
- What it is. A Databricks cost breakdown in three steps. Find the category that costs most, then the SKU inside it, then the warehouse or cluster spending the money.
- Who it is for. Data platform leads and managers who answer for Databricks spend across more than one workspace.
- What you get. One bill turned into a short list of resources to fix. Setup is read-only. Nothing runs on your clusters.
Start the Databricks Cost Breakdown at the Costliest Category
Your invoice is one number. It names nothing you can act on. The Summary page splits the same spend into five categories:
- Clusters. All-purpose and job compute.
- SQL Warehouse. Classic, Pro and Serverless.
- AI/ML. Model serving and vector search.
- Lakehouse. Platform and storage.
- Platform. Overhead and other SKUs.
One category is always the most costly. That one decides where your month goes.
For most enterprises the most costly category is Clusters. Job clusters run every scheduled batch load. All-purpose clusters stay open all day for analysts. Smaller accounts spend most on SQL Warehouse instead.
Here is an example. A week costs about $12K. SQL Warehouse is roughly $6K of it and Clusters about $5.6K. SQL Warehouse costs most, so that is where you can start diagnosing.

Each category splits again into the types Databricks bills for. Clusters splits into Jobs, All Purpose, DLT and Interactive. SQL Warehouse splits into Classic, Pro and Serverless. Follow the costliest type down. Here, most of the SQL Warehouse spend is Serverless.

Take That Category Down to the SKU You Pay For
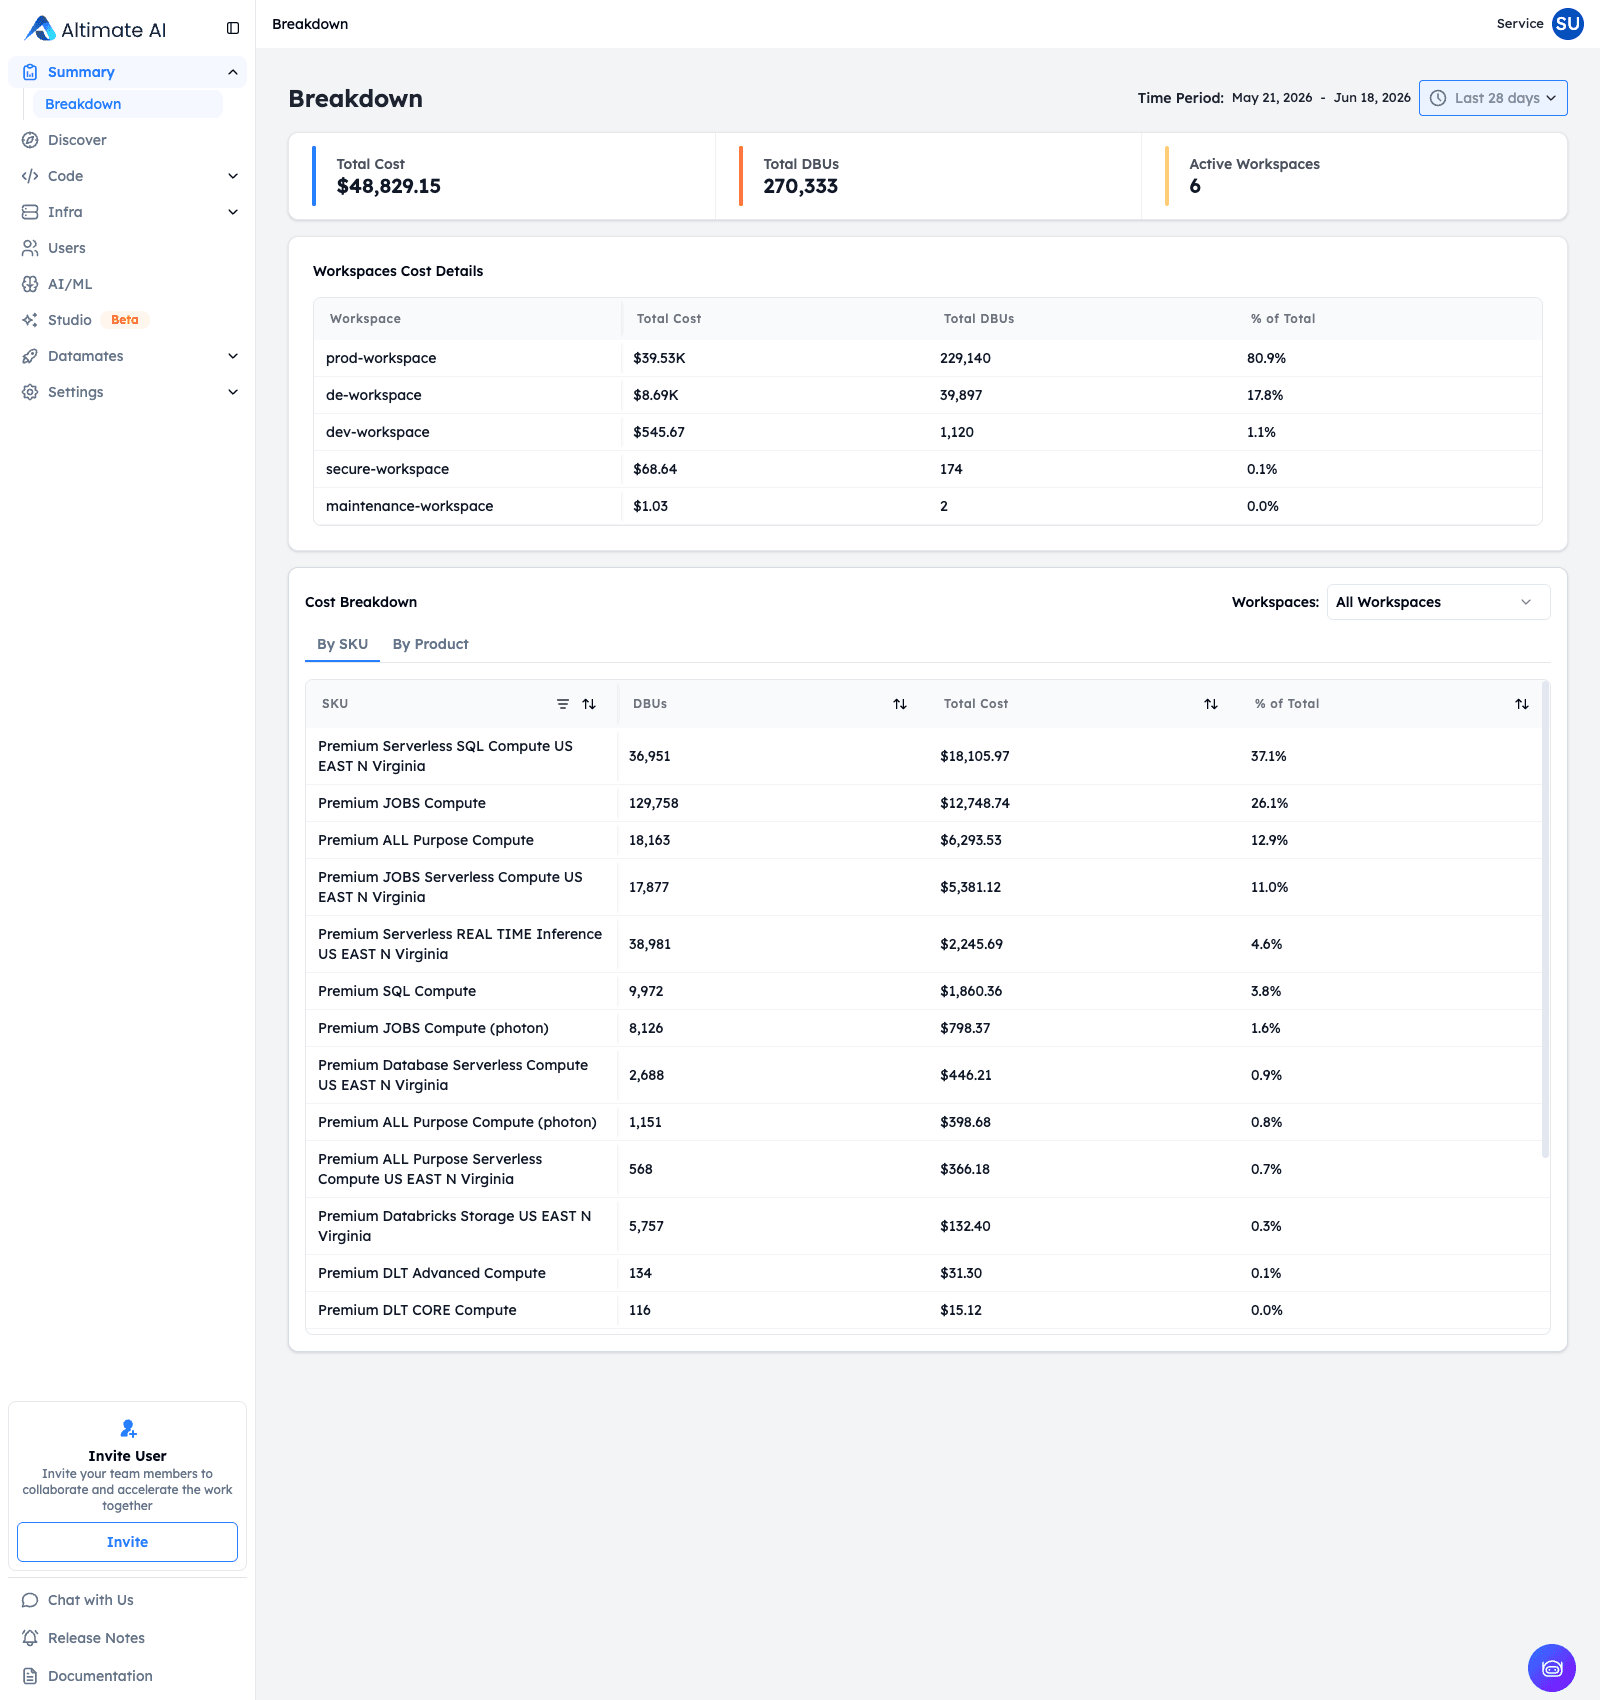
A category tells you where to look. A SKU tells you what you pay for. The SKU is the billing unit in Databricks. The Breakdown page lists every SKU with its DBUs, its cost and its share of the bill. It sorts them by cost, so the top row is your answer.
Keep the worked example going. The month costs about $49K. The top SKU is a serverless SQL compute line at roughly $18K. That one row is more than a third of the whole bill.
The same page also splits the bill by workspace. One production workspace might hold about 80% of the spend. That per-workspace number is what Databricks chargeback runs on.
Name the Warehouses and Clusters That Spend the Money
The last step is the resource itself. The SQL Warehouses page gives every warehouse a row, sorted by cost. Say fifteen warehouses share the bill. The top one is near $6K and the next two about $4.5K each. Everything below them is small.
That is three owners to talk to, not fifteen. The Clusters page does the same for job and all-purpose compute.
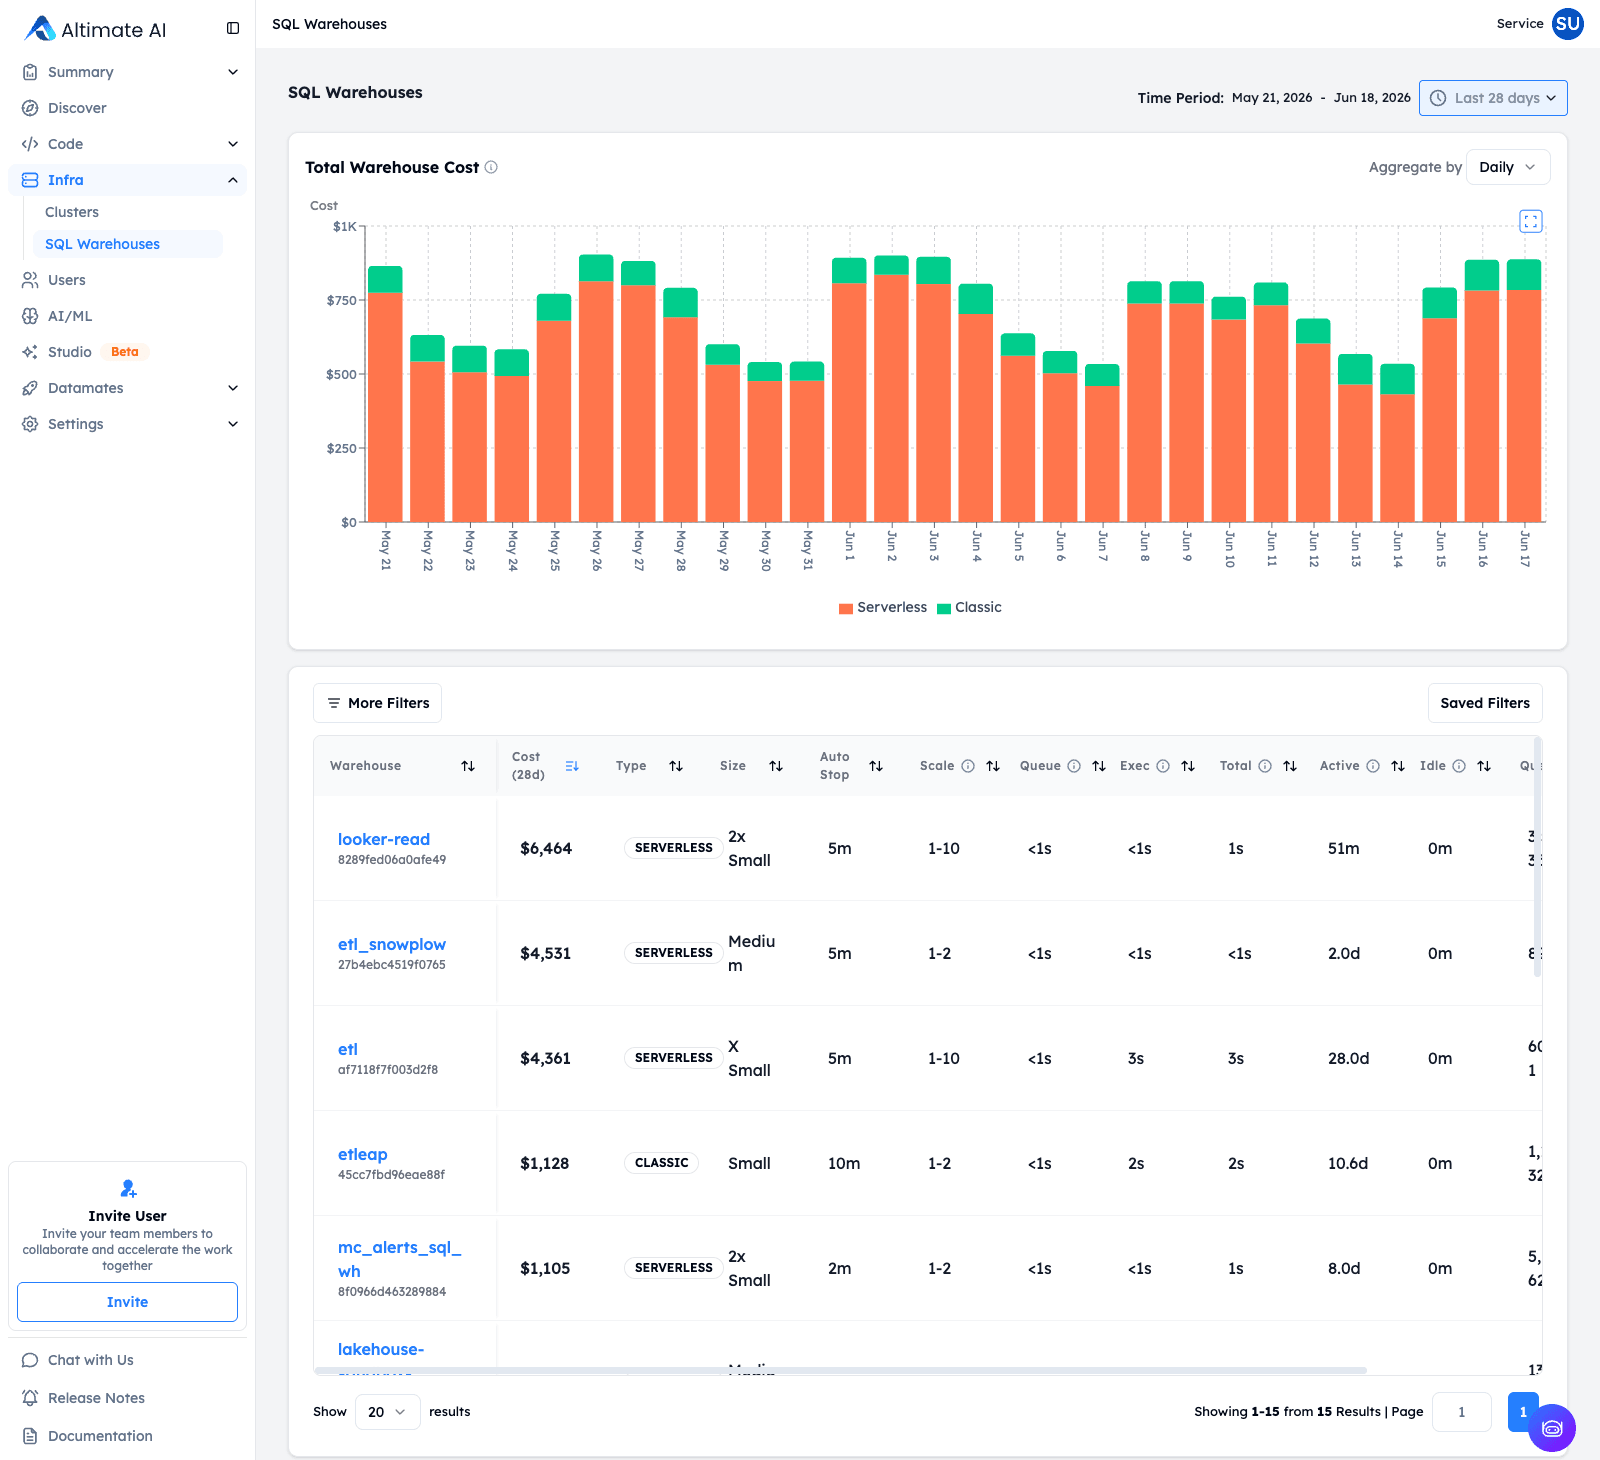
Switch the chart between daily and weekly to give a spike a date. Serverless spend might sit near $900 a day, drop for a few days, then jump back over $900. Now you stop asking why the month rose. You ask what changed that day.

One thing these pages will not tell you. They cannot say whether a warehouse is the right size. No column decides that. Average CPU and average memory do not decide it either. Sizing is Auto Tune's job, and this page tells Auto Tune where to start.
Altimate for Databricks is where a Databricks team begins.
Talk to us about your warehouse
Frequently Asked Questions
Clusters covers all-purpose and job compute. SQL Warehouse covers Classic, Pro and Serverless warehouse compute. AI/ML covers model serving, vector search and other ML workloads. Lakehouse covers platform and storage. Platform covers overhead and miscellaneous SKUs. The Summary page charts all five across the period you choose.
The SKU is the unit Databricks bills you in, so it is the most precise name your spend has. Premium Serverless SQL Compute and Premium JOBS Compute are separate SKUs at separate DBU rates. Serverless SKUs also carry a region in the name, such as US EAST N Virginia. The same compute costs differently by region.
There are four: Jobs, All Purpose, DLT and Interactive. Job clusters run scheduled and batch workloads, then spin down. All-purpose clusters stay available for ad hoc work from analysts and data scientists. That is why they often cost the most. DLT and Interactive are usually the smaller pair.
Databricks charges for Classic, Pro and Serverless separately. The Summary chart plots them as three bands, so you can see which one moved. The split matters because serverless bills at a different rate for a different thing. A rising serverless band and a rising classic band need two different fixes.
The Breakdown page carries a Workspaces Cost Details table with one row per workspace. Each row gives the name, the total cost for the window, the DBUs consumed and the share of overall spend. The page header adds the total cost, the total DBUs and the count of workspaces with any activity.
By SKU goes down to the billing unit, with DBUs, cost and share on every row. One such row is Premium Serverless SQL Compute US EAST N Virginia. By Product rolls the same spend up into SQL, JOBS, ALL Purpose, Model Serving and DLT. Use SKU to find the charge and Product to brief someone quickly.
Widen the window, then switch the aggregate between daily and weekly. Weekly tells you which week broke pattern, and daily tells you which day inside it. Once you have the date, set the resource table to that same window. It names the warehouse or cluster carrying the cost that day.
No, and it should not pretend to. No column, ratio or usage figure on these pages decides whether a resource is right-sized. Average CPU and average memory in particular do not settle it, because a hot cluster can be retrying failed jobs or spilling data to disk. That is a reason to look harder, not a reason to leave it alone.
Yes, that is what the per-workspace and per-product views are for. Use them to allocate cost by workspace, to charge back or show back, to compare SKU choices and to plan capacity. The Enterprise Platform overview describes the rest of the product, and the detailed documentation sits behind a partner login.