- What it is. Root cause analysis for any Snowflake workload. It covers every run of your dbt models, Tableau workloads, notebooks, stored procedures and Streamlit apps. Compare two runs and the AI names the cause: the warehouse, the task count, or the code. dbt and Tableau come in through connections you already made, and Snowflake queries need a tag so their runs group into a workload.
- Who it is for. Analytics engineers, data platform leads and whoever is on call when the nightly job doubles.
- What you get. You find out why the nightly job doubled, without reading three sets of logs.
Root Cause Analysis Starts with Every Snowflake Workload Run
Your nightly job took eighty minutes last night instead of forty. Three tools each hold part of the answer, and none of them holds all of it. So you read the dbt logs, then query history, then the Tableau admin views. By the time you have an answer, the next run has already started.
The Code section reads all of it in one place. You get a run history for each of these:
- dbt models, through the dbt connection you already made.
- Tableau workloads, once the refresh queries carry a tag.
- Notebooks.
- Stored procedures.
- Streamlit apps.
Under any single run you also get the child queries that ran inside it. Cost and run time sit on the same chart. A run that got expensive and a run that got slow are one investigation instead of two.
Here is one workload over 28 days. The blue line is what each run cost you. The purple line is how long each run took. Across 31 runs it averaged 22 minutes 54 seconds and $2.27, and its worst run took 1 hour 6 minutes. That worst run is the one you go and compare.
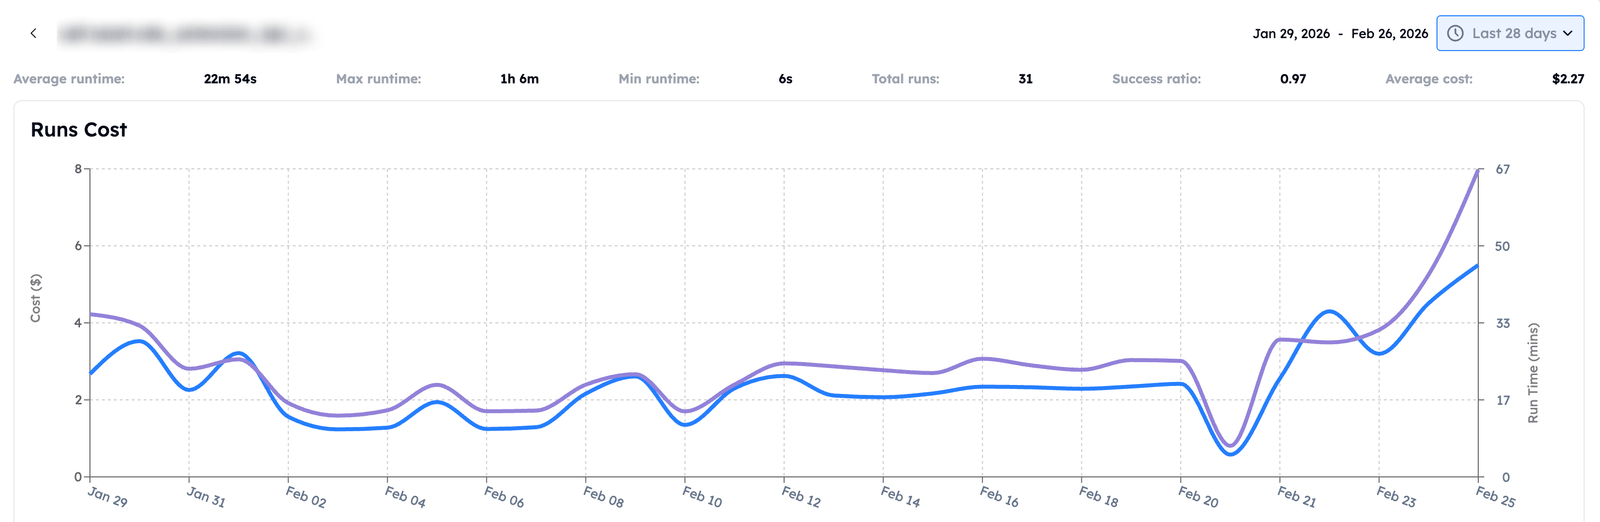
Each point on this chart is one run. When the run's makeup changes, the chart flags that point as changed. That flag is the task-count cause showing up before you even compare two runs.

Compare Two Runs to Find Out What Changed
The platform's AI compares two runs of the same workload and names the root cause of a spike or a drop. It comes back with one of three things:
| Cause | What it means |
|---|---|
| The warehouse | The warehouse this workload ran on changed. |
| The task count | The workload ran a different number of tasks this time. |
| The code | The code behind the workload changed. |
Three causes will not explain every incident. They do cover the ones your runbook can act on, and the rest usually trace back to one of them. Every workload type goes through the same three checks, whether it is a dbt model or a Streamlit app.
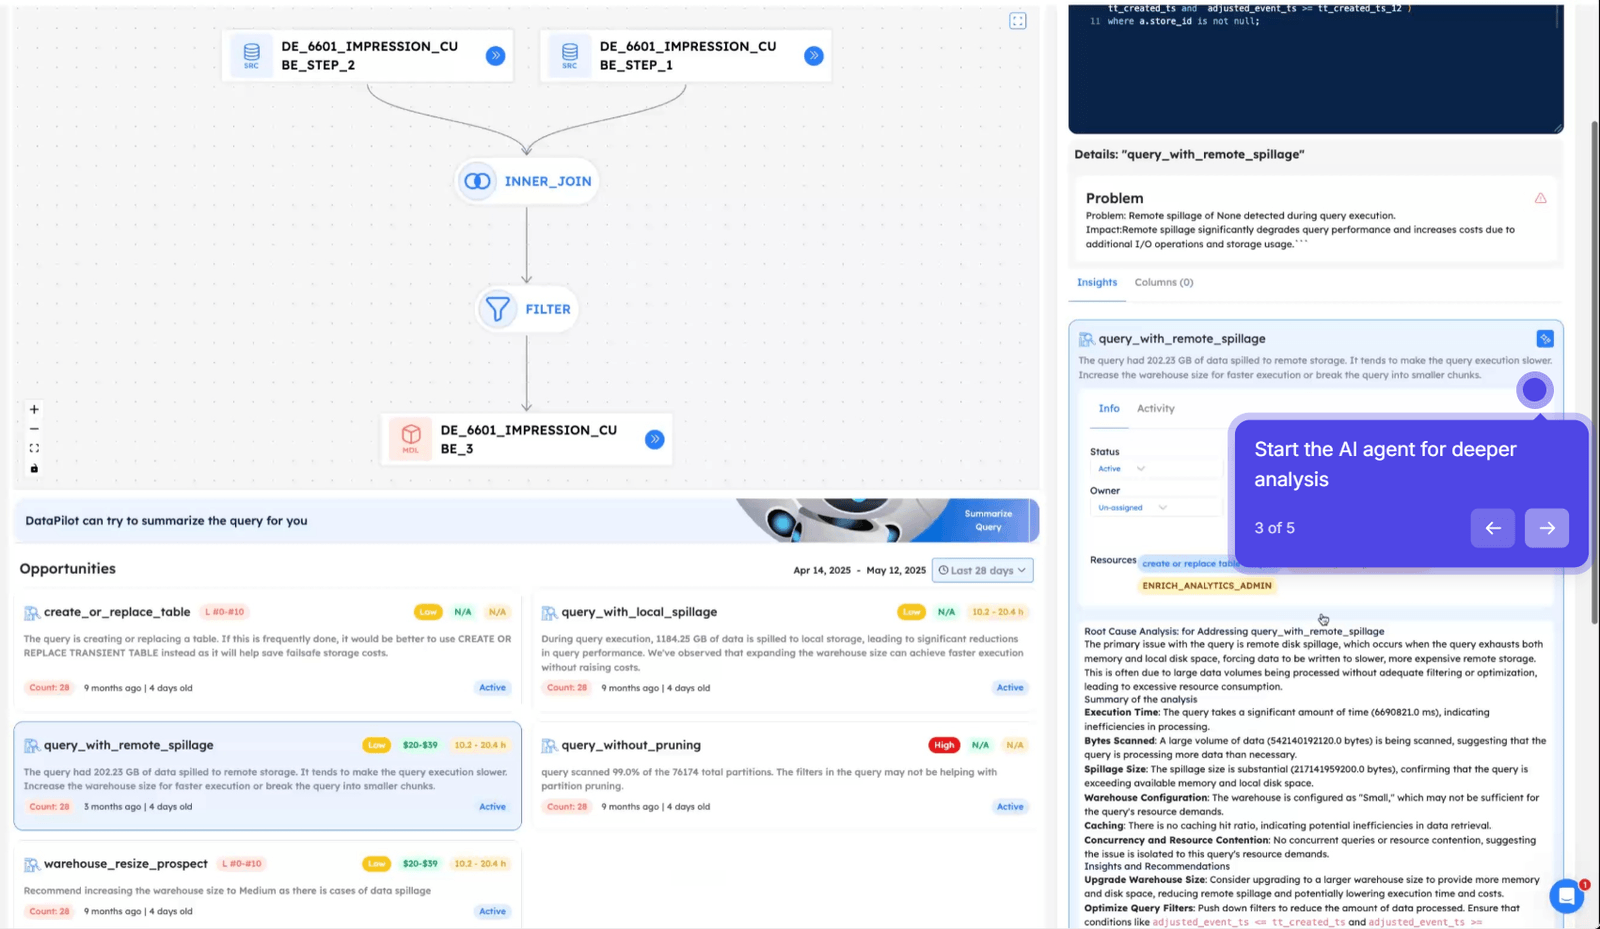
When the warehouse is the cause, you get more than a direction to look in. You get the query's lineage, and a written cause. Here that cause is 202.23 GB spilled to remote storage because the warehouse was sized Small. The recommendation comes with it. Run the query on a larger size, or split it into smaller chunks.
Send the Cause to Jira, Linear, or an Agentic IDE
Once the cause has a name, it stops being an investigation and becomes work. From the opportunity you send it out as a Jira or Linear ticket, or open it in an agentic IDE with the prompt already written.

You choose where the work lands and who owns it. The platform files against Jira or Linear through the Datamate that holds that integration. The ticket reaches the team that already runs on it. Here only Jira is connected.

What matters is what travels with the ticket. It carries the opportunity, the resource and the recommended fix. Whoever picks it up does not have to start by working out what went wrong. If you would rather send it yourself, Studio opens with the prompt already written, and the Datamate already selected.

What You Get Instead of an Hour of Log Reading
- One place for every workload. dbt models, Tableau workloads, notebooks, stored procedures and Streamlit apps. Each keeps its own run history.
- A named cause instead of a theory. The warehouse, the task count, or the code.
- The query that got expensive. Every run lists the child queries that ran inside it, so the finding points at one query and not at the whole job.
- A ticket someone can pick up. Jira, Linear, or an agentic IDE. The opportunity, the resource and the fix are already written into the prompt.
On the workload above, one run took 1 hour 6 minutes against a 22 minute 54 second average. The AI named one cause: 202.23 GB spilled to remote storage on a Small warehouse. You get one query, one reason and one recommendation, rather than a cost line that went up and a shortlist of suspects.
For the wider Snowflake cost picture around this, see Altimate for Snowflake.
Talk to us about your warehouse
Frequently Asked Questions
Everything under the Code section. dbt jobs, models and runs. Tableau dashboard refreshes and tagged queries. Notebooks, stored procedures and Streamlit apps. Each type keeps its own run history, and every run lists the child queries that ran inside it. The comparison between two runs is built from those.
Warehouse changes, task-count changes and code changes. The Workloads documentation describes it as comparing different runs of a workload to find the root cause of a spike or a drop. It names those three as the reasons behind a shift in cost or run time.
Because the tools do not share a vocabulary. The dbt runner has its own log format, Tableau has its own admin views, and Snowflake has query history. At two in the morning you are the one stitching them together by hand. Here one page reads all of them.
The dbt connection you already made. The Code section reads your dbt jobs, models and their runs with the costs attached. So you compare a model that ran longer against that same model's earlier runs. There is no log file to read. Model documentation and column lineage sit in the same section.
Tag the queries the refresh issues, through the Edit Initial SQL flow on the data source. Untagged, a dashboard refresh tells you nothing. All you see is a bigger warehouse bill that no team owns. The tag turns that refresh into a query set with its own history. A refresh that got expensive then names the query that did it.
They work like every other workload type. You get a run history, and the child queries under each run. The comparison reads both. The finding points at the one child query that got more expensive, not at the whole notebook.
This is the zoomed-out version. Here you compare a workload run against its own earlier runs, and the cause comes back as one of three things. Tracking a single query across its executions is the same idea at query level instead of workload level, on the same account.
The Workloads, dbt Models and Tableau Workloads pages. Those sit behind a partner login, because the platform documentation is gated. The Enterprise Platform overview is the public description, and your account team can walk this through on your own workloads.