- What it is. Snowflake query cost over time, with every run of the same query under one row on the Code page. Each run carries what the platform found wrong with it, so you can compare one run to the next. Nothing to configure.
- Who it is for. Analytics engineers and data platform leads who own long-lived queries behind dashboards and nightly jobs.
- What you get. You find the exact run where a query started costing more, and what changed on it.
Snowflake Query Cost Over Time Sits Under One Row
A query took twelve minutes six months ago. Today it takes forty. It never tripped an alert, because each week only added a minute or two as the upstream table grew. Nobody checks one query week by week.
The Groups tab on the Code page does that checking for you. One row is one query. Every run of it sits under that row, going back as far as your history does. The platform writes the group name, so you can tell what a row is before you open it.
The problem is that the same query rarely looks identical twice. A nightly job filters on a rolling date window, so its text and its hash change every run. Match on that hash and you see thousands of one-off queries that never repeat. The platform reads past the changing dates and files every run of that query under one group.
That gives one query a stable identity across months of runs. A dashboard firing the same SELECT every night becomes one row, with all of those runs under it. You are no longer matching up thousands of separate executions by hand.
See What the Platform Found Wrong on Each Run
The platform checks every run against a list of known anti-patterns, and the finding it attaches to that run is called an insight. Insights have names like warehouse_resize_prospect, query_with_local_spillage and query_timed_out.
An insight applies at one of two levels:
| Level | Scope | Example |
|---|---|---|
| Group Insight | The query and every run of it | zero_impact, warehouse_resize_prospect |
| Per-run insight | One single execution | query_timed_out on last night's run but not the night before |
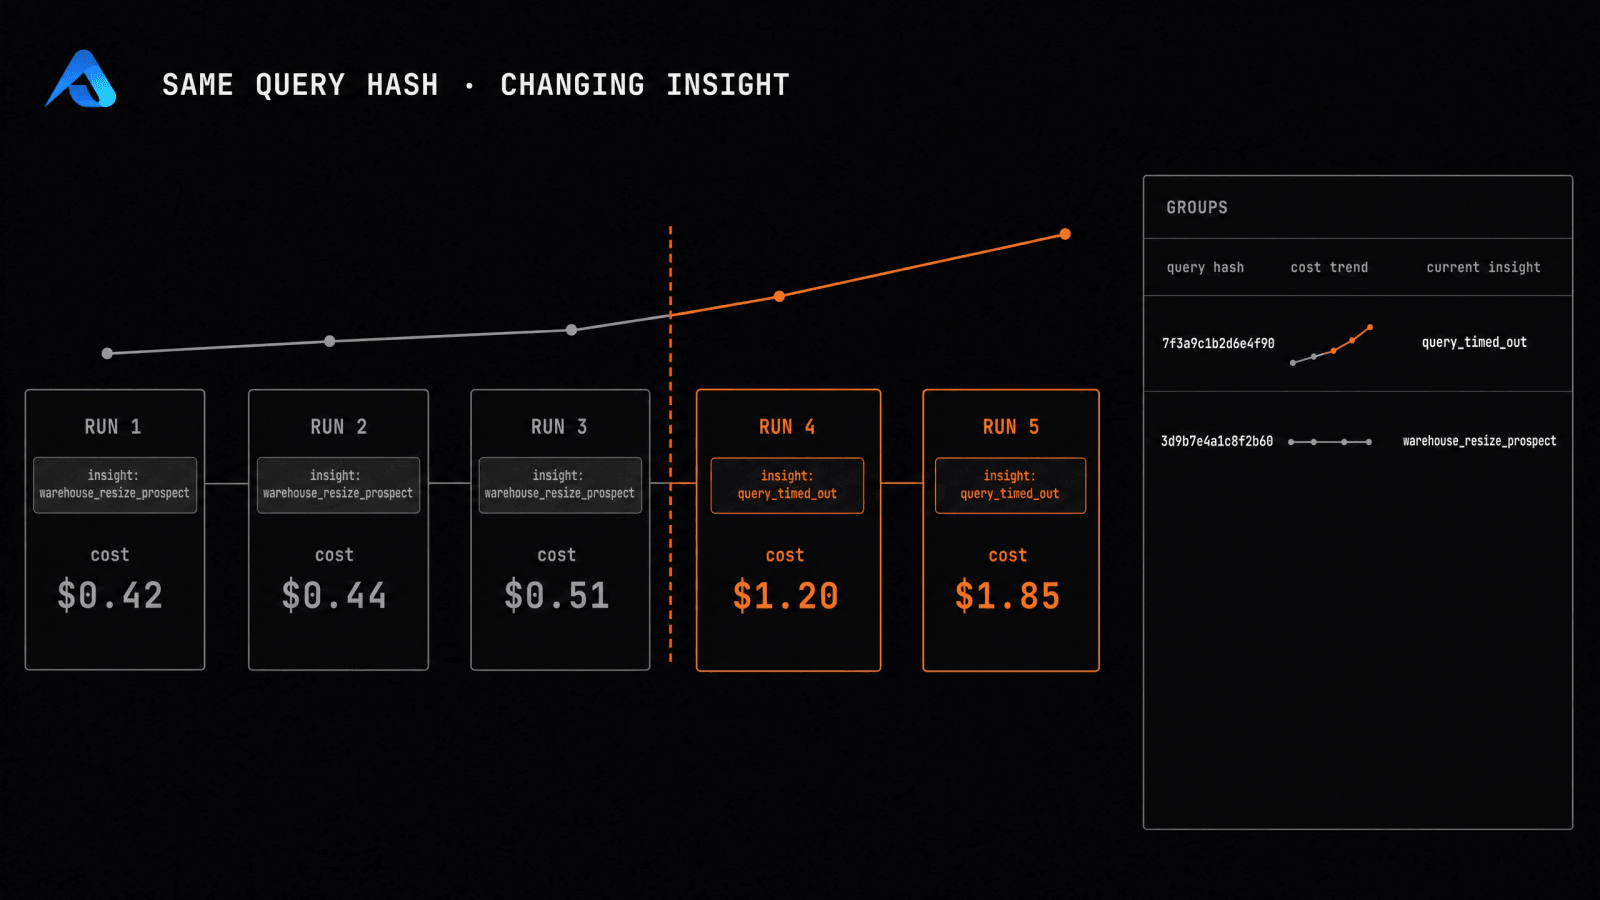
Say a query used to come back warehouse_resize_prospect and now comes back query_timed_out. That tells you two things. The platform first thought the warehouse was too small for that query. Later, the same query stopped finishing at all.
You also get a date out of it. The insight changed on one specific run. It did not drift a little at a time across all of them. You know which day to look at. A rising cost line on its own can never tell you that.
The diagram below follows one query across five runs, with the run where the insight changed marked in red.
Rank Every Query by What It Cost You
The Groups tab is the list you audit from. Every query is one row. You sort those rows by total cost or by cost trend, and each row also shows the insight that applies to it right now.
Here one group ran 120 times in four weeks, at a 55 minute average and $3.89K total across those runs.

Sort by cost trend and the query that has been getting more expensive comes to the top of the list. You did not have to know that query existed to find it.
Each row rolls up from the Queries feed. Every single execution in that feed already carries its own estimated cost, how long it ran, and its insight tags.
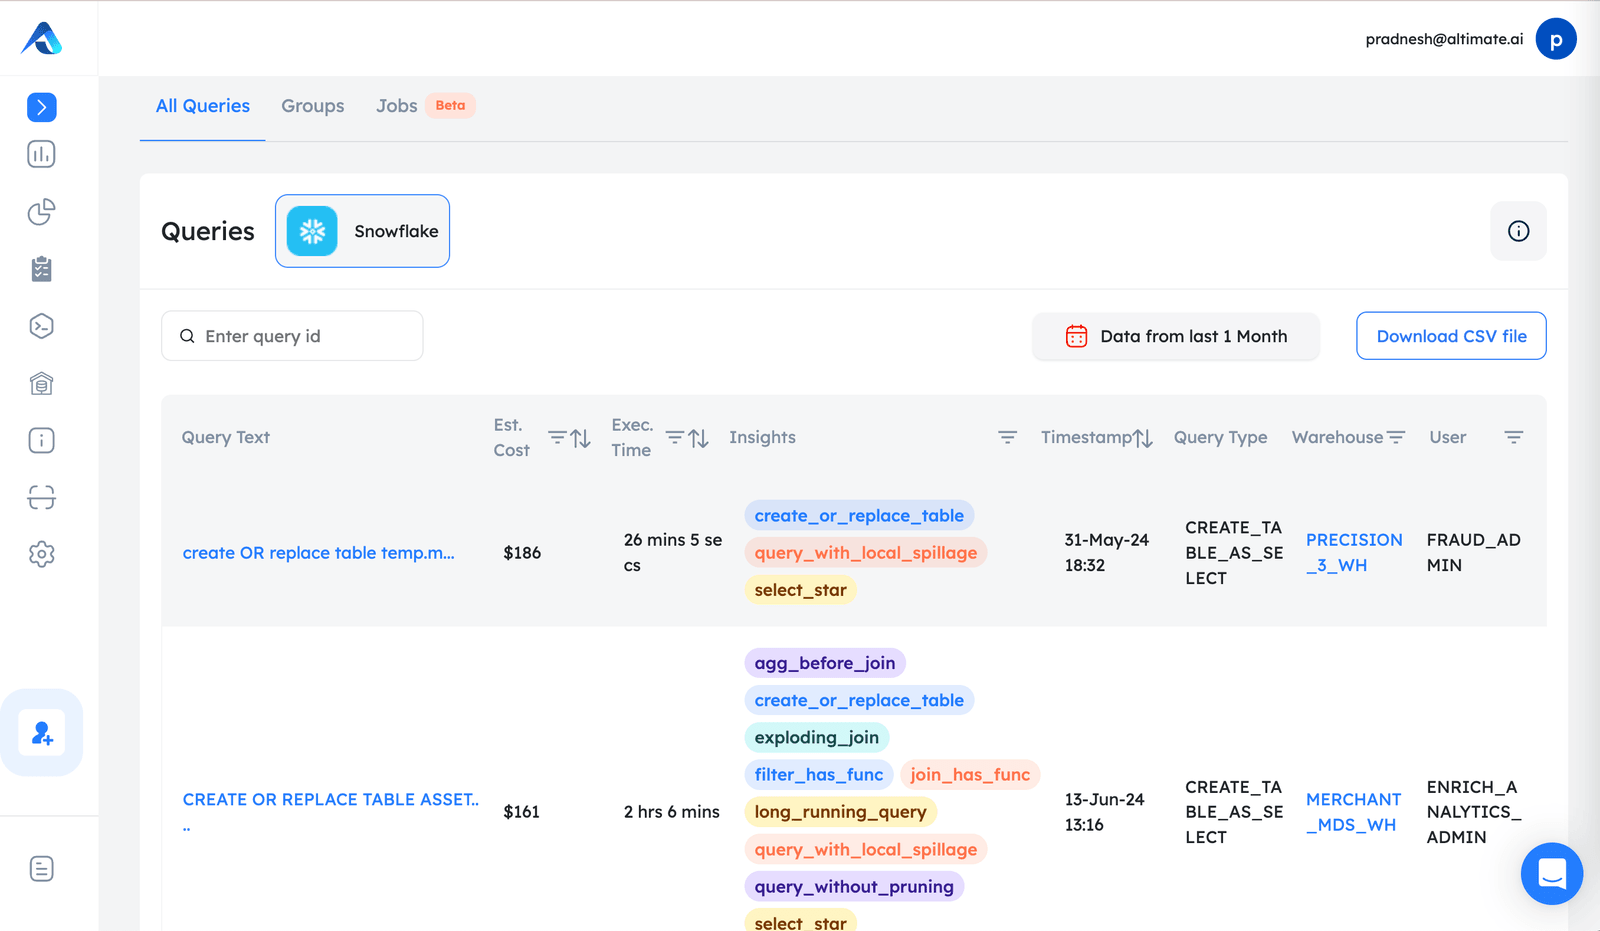
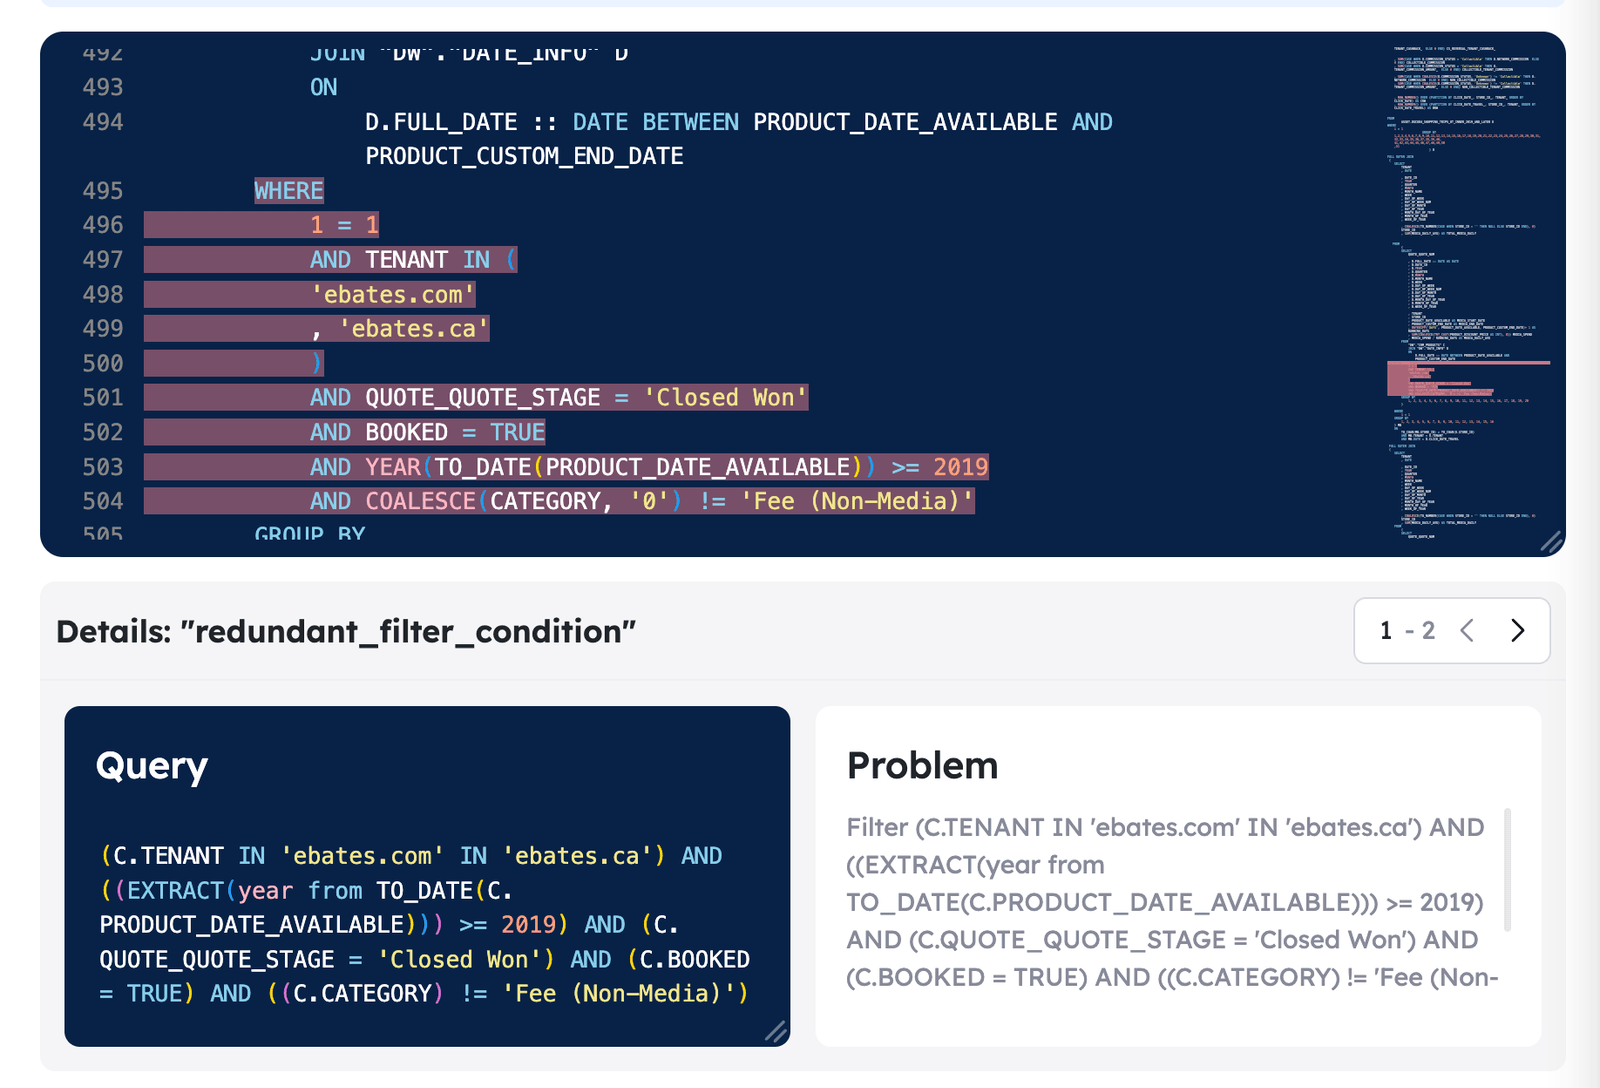
You can click a tag. Click redundant_filter_condition and the detail view highlights the exact lines of the WHERE clause behind it. Below that, it restates the filter in plain words.
What You Get from One Query Group
A group gives you more than a list of runs. It tells you what is wrong across every run of a query at once. Then you open the one run that proves it.
The opportunities on a group apply to the whole group, not a single run. Every run of this query spills 26.05 GB to local storage. So one fix, resize the warehouse, pays off across all 120 runs at once.

From there you open any single run, each with its own cost, run time and timestamp. That is where a group-wide finding turns into the one run you go and read.

- A cost history per query. Every run of it, with what each run cost you.
- The run where it changed. The one execution where the insight went from one problem to another.
- The clause to fix. The lines of SQL behind that insight, highlighted for you.
A run's cost is not the warehouse bill divided by the number of queries. The platform reads everything else running on that warehouse at the same time and splits the cost on that basis. That is what makes one run comparable to the run before it. Without it, a cost trend would only be telling you how busy the warehouse was that night.
Query Insights is part of the Enterprise Platform, and the Enterprise Platform overview covers the rest of what it tracks on your Snowflake spend.
Talk to us about your warehouse
Frequently Asked Questions
The Groups tab matches queries by their pattern, not their exact text. A rolling date window changes the text and the hash on every run, but the pattern stays the same. The platform reads past those dates and files every run under one group. One row is one query, every run sits underneath it, and you configure nothing to get this.
A Group Insight applies to the query and all of its runs, for example zero_impact or warehouse_resize_prospect. A per-run insight applies to one execution, for example query_timed_out on last night's run but not the night before. When a per-run insight shows up where it never used to, that is your regression.
Silent ones. A query that got slower because an upstream table doubled. A query that started spilling to remote storage after someone reshaped a warehouse. A query that began retrying under contention. All three change the insight between runs. A plain cost chart would show the line going up and tell you nothing about why.
Yes, for the insights that point at a piece of SQL. Click the tag and the detail view highlights the exact code behind it, next to a plain restatement of what that code does. A redundant filter condition gives you the predicate itself, plus the reason the extra test buys you nothing.
A job is a set of queries that ran together, and the platform spots those sets and names them for you. Open any query in a group and you get the insights for that one execution. Use See Group Insights for the findings that apply to the whole group.
The platform looks at everything else running on that warehouse at the same time and splits the cost on that basis. It does not divide the bill flatly across queries. That is what makes one run comparable to the run before it. Without it, a cost trend would only tell you how busy the warehouse was that night.
The size of the thing you compare. Workload root-cause analysis compares two runs of a whole workload. It names one of three causes: the warehouse, the task count, or the code. This is the same idea one level down, on the same account. The unit is a single query, and the evidence is the insight on each of its runs.
The Query Insights documentation sits behind a partner login. It covers the Groups tab, See Group Insights, Summarize Query and the Query Explanation agent. Altimate for Snowflake is the public description, and your account team can run the Groups tab against your own query history.