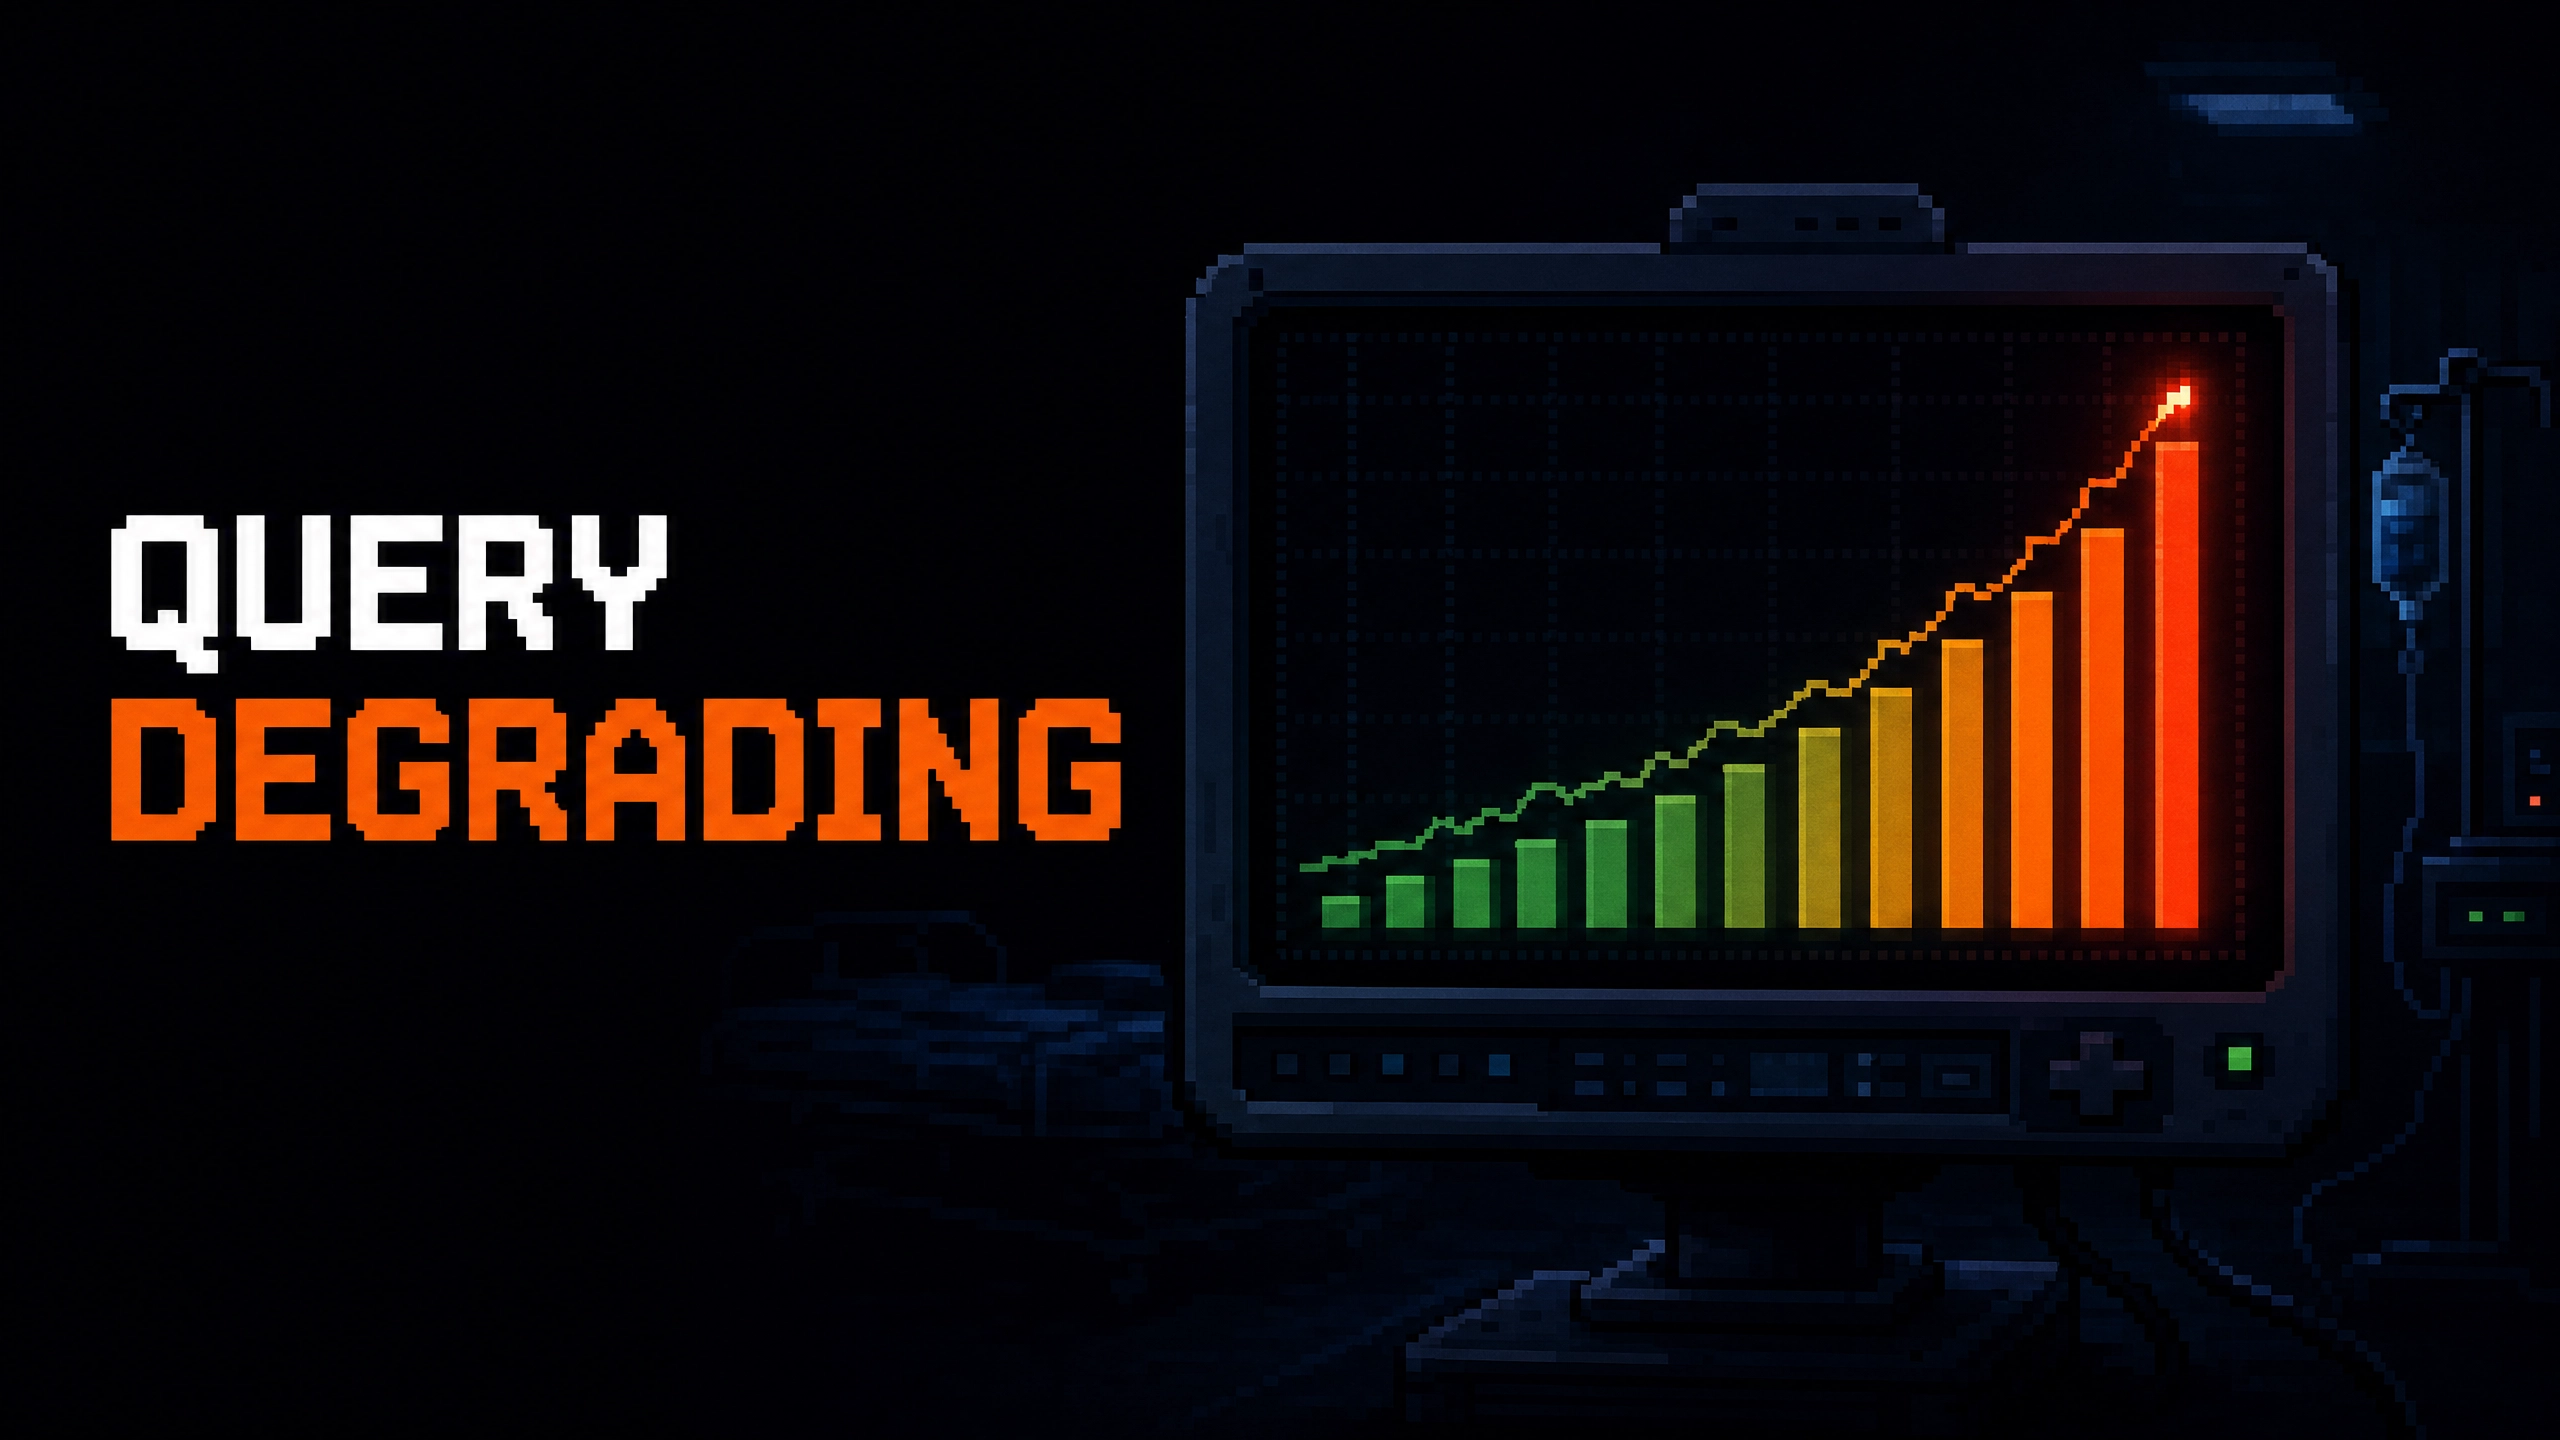
- Pain. Query performance can degrade so gradually that no single run ever crosses an alert threshold, until months of small drift compound into a genuinely expensive query nobody flagged.
- Who it is for. Analytics engineers and data platform leads owning long-lived Snowflake queries.
- What it is. The Enterprise Platform's Query Insights surface tracks a query's hash over time and flags when its diagnosis changes run to run.
Drift Is The Class Of Cost Regression Nobody Catches
A gaming analytics team runs a nightly query that powers a daily-active-users report. Six months ago the query took twelve minutes; today it takes forty. No single week showed a big jump; every week added a couple of minutes as the upstream event table grew. The team never noticed because nobody watches a query at that resolution, and the dashboard showing "query duration over time" is a straight line to nobody on the team.
The pattern is a query with a slow trend and no attribution for when the trend started. The query-hash run history is the surface that names the run.
Snowflake's Query Hash Is The Identity
Snowflake computes a query hash on every execution: identical query text (with literals normalised out) maps to the same hash. The Query Insights page uses that hash as the primary key for the Groups tab. Groups are named automatically ("group name auto-generated using Generative AI", per the doc). Each group carries a run history: every execution of that query hash, with its cost, duration, warehouse, and insight.
The identity is the hash; the history is the sequence of runs; the diff is the change between the sequence's own rows. The query becomes a time series, not a single row.
The Insight Itself Moves Between Runs
The Query Insights catalogue is not static labels; each run gets classified with a specific insight from the platform's anti-pattern taxonomy. That taxonomy includes patterns like warehouse_resize_prospect, query_with_local_spillage, query_timed_out, and query_retried_by_warehouse (see the Snowflake anti-patterns article for the full list).
A query that used to earn warehouse_resize_prospect and later earns query_timed_out is a specific narrative: the platform saw the query as a candidate to resize the warehouse for, then saw it exceed the warehouse's real timeout. That is a regression with a shape, not just a rising cost line. The run history shows the transition, so the RCA reads "run at 2026-06-14 was the first time the query produced query_timed_out, previous runs consistently produced warehouse_resize_prospect". The insight is the diagnostic, and the diagnostic moves.
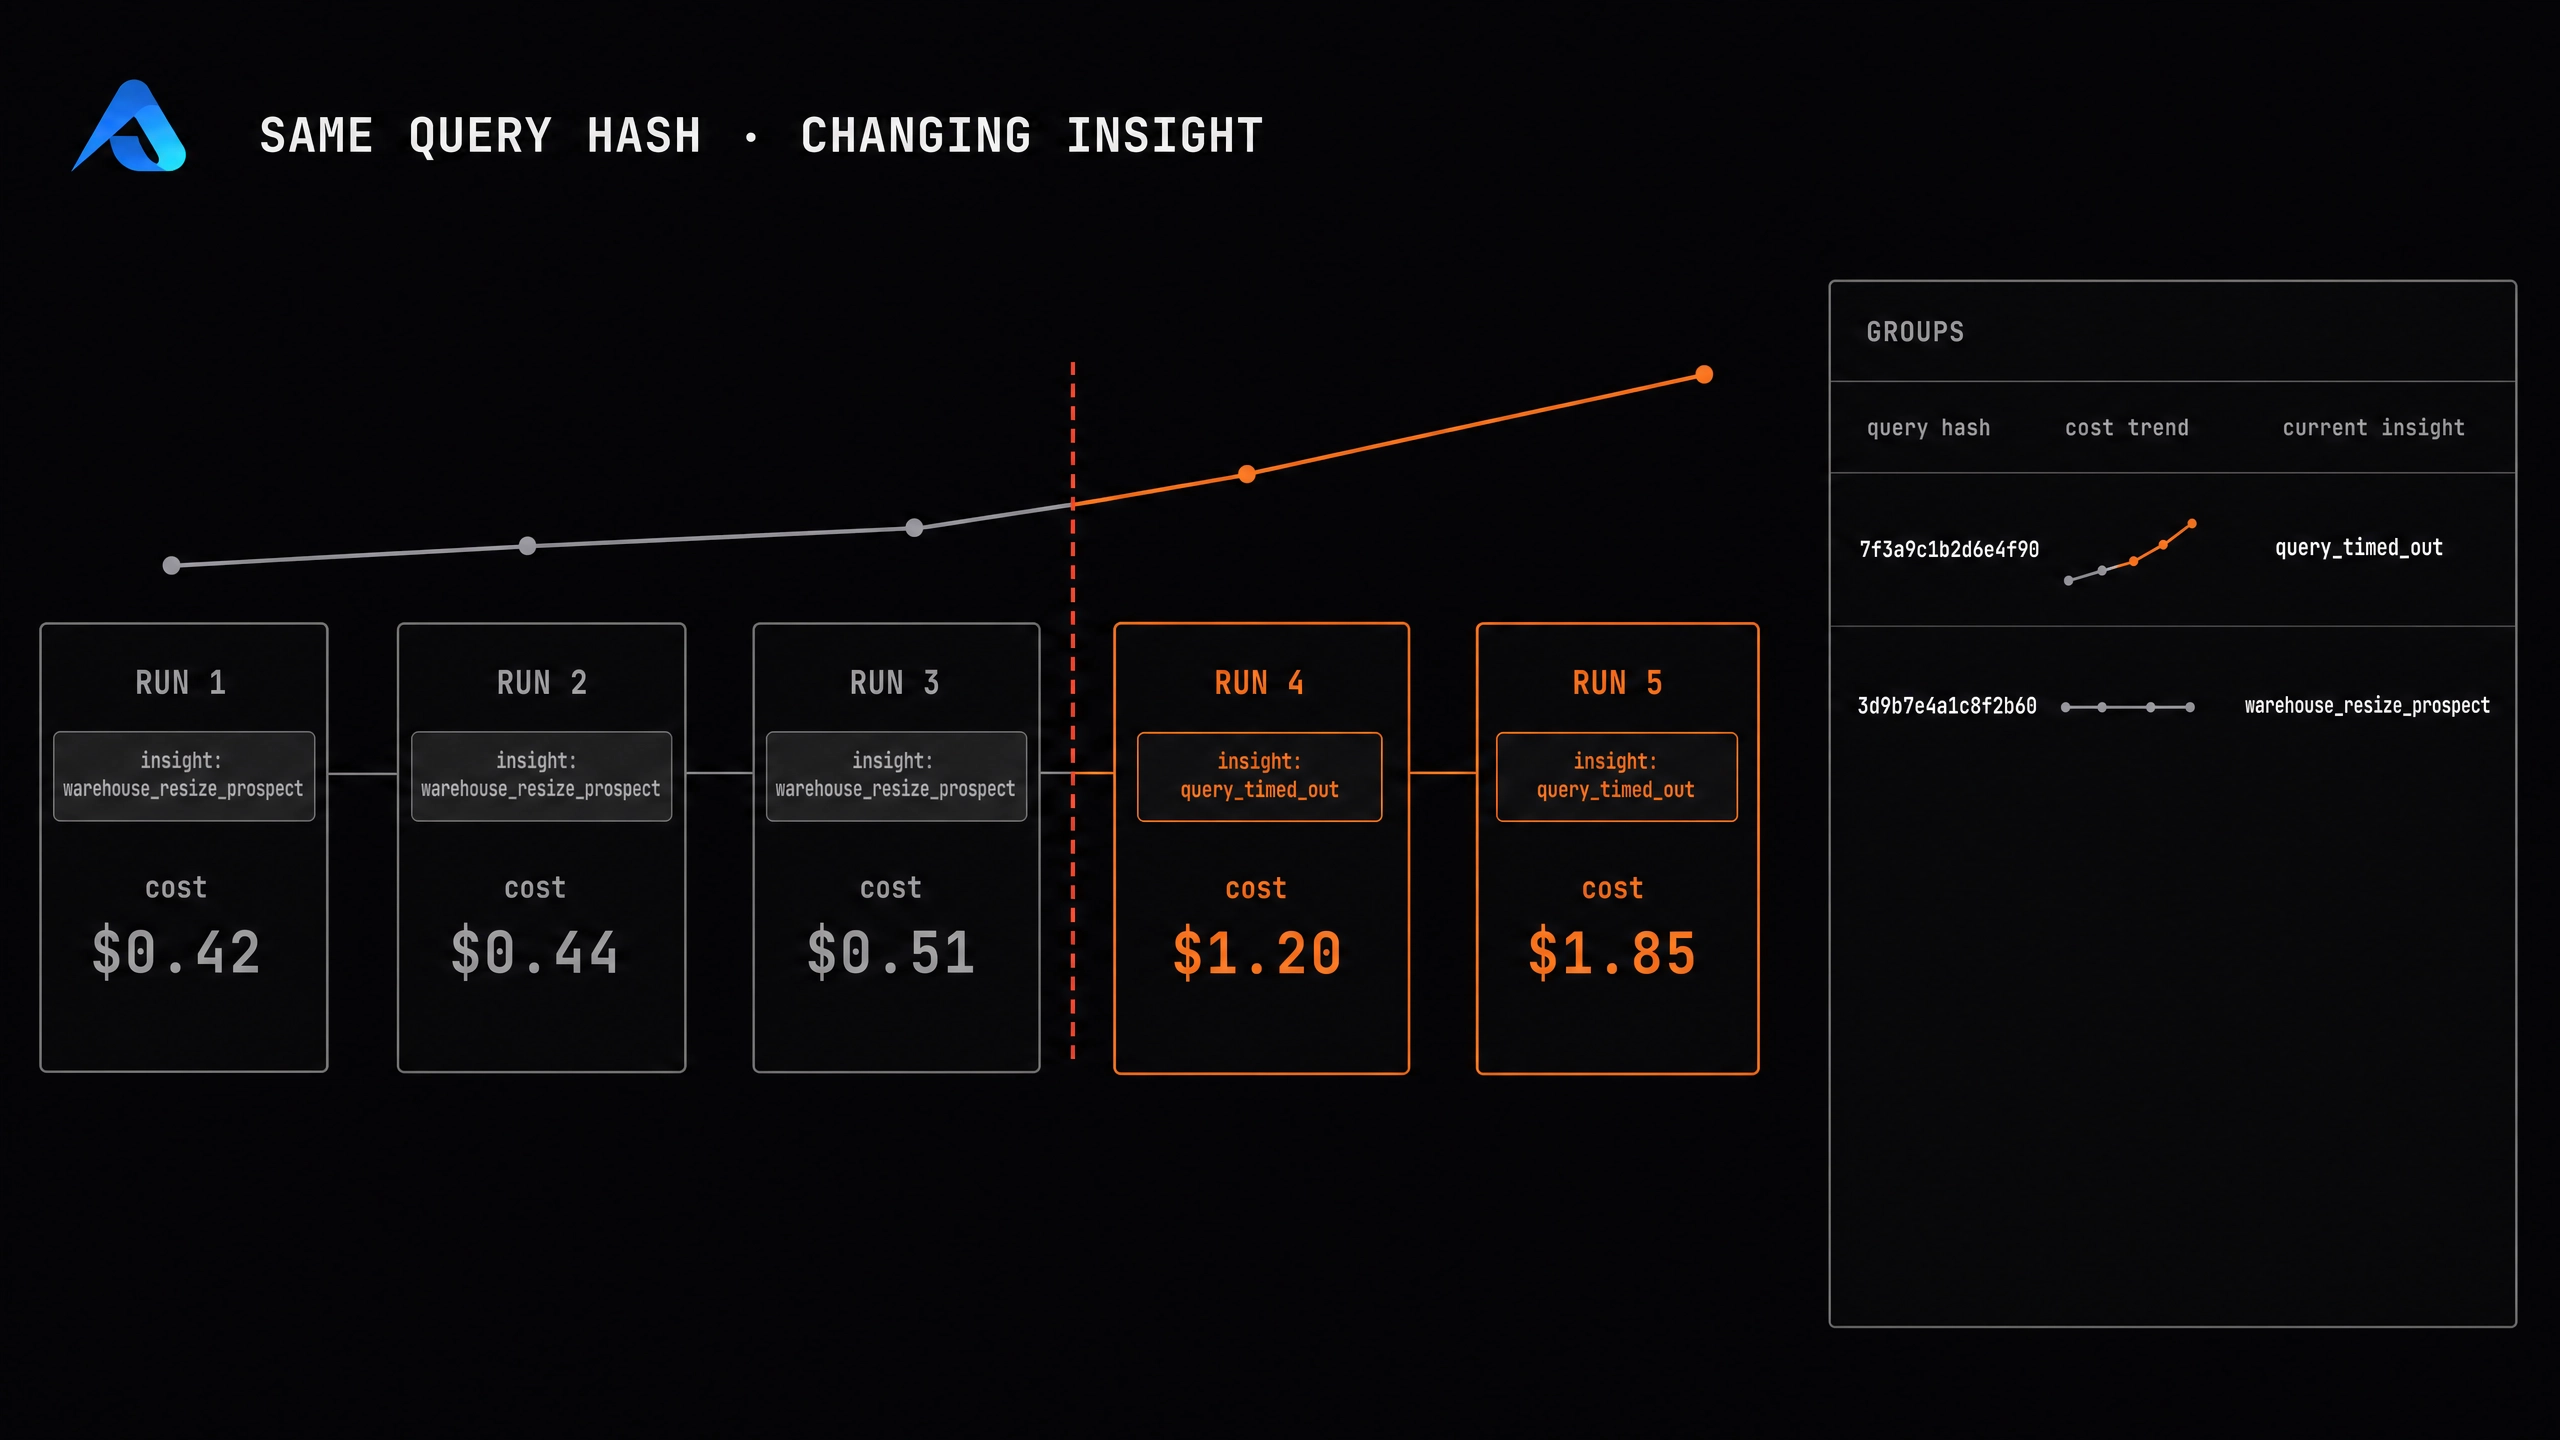
The Groups Tab Is The Audit List
Groups are the audit list: one row per query hash, sorted by cumulative cost or by trend. For the query the team never noticed, the Group row shows a cost line that grew over months and a current insight that no longer matches the insights from a quarter ago. Clicking into the Group opens the run history, and the run history reads left-to-right as the query's own biography.
For queries that are important to a team, the Group becomes a subscription target: the team-alert article covers the subscription pipeline that can fire when a Group's cost breaches a threshold. The audit list becomes the alert target.
Complementary To The Paste-A-Query-ID Rewrite
The query-hash history diagnoses; the Studio flow rewrites. The paste-a-query-ID article covers the surface where an engineer takes a specific query ID from the Group's run history and gets a rewritten version with expected impact. The two surfaces read the same account and reference the same query object. Diagnosis and treatment share the query.
What Lands When The Query Becomes A Time Series
Snowflake's query hash is the query's identity across runs. The Query Insights Groups tab reads that identity and shows one row per hash with its cost history, current insight, and previous-run insight. The transition between insights is the regression signal the static cost dashboard misses. The workload RCA article covers the zoomed-out version at workload level; this article is the query-level version. The query stops being one row; it becomes a timeline with its own regressions.