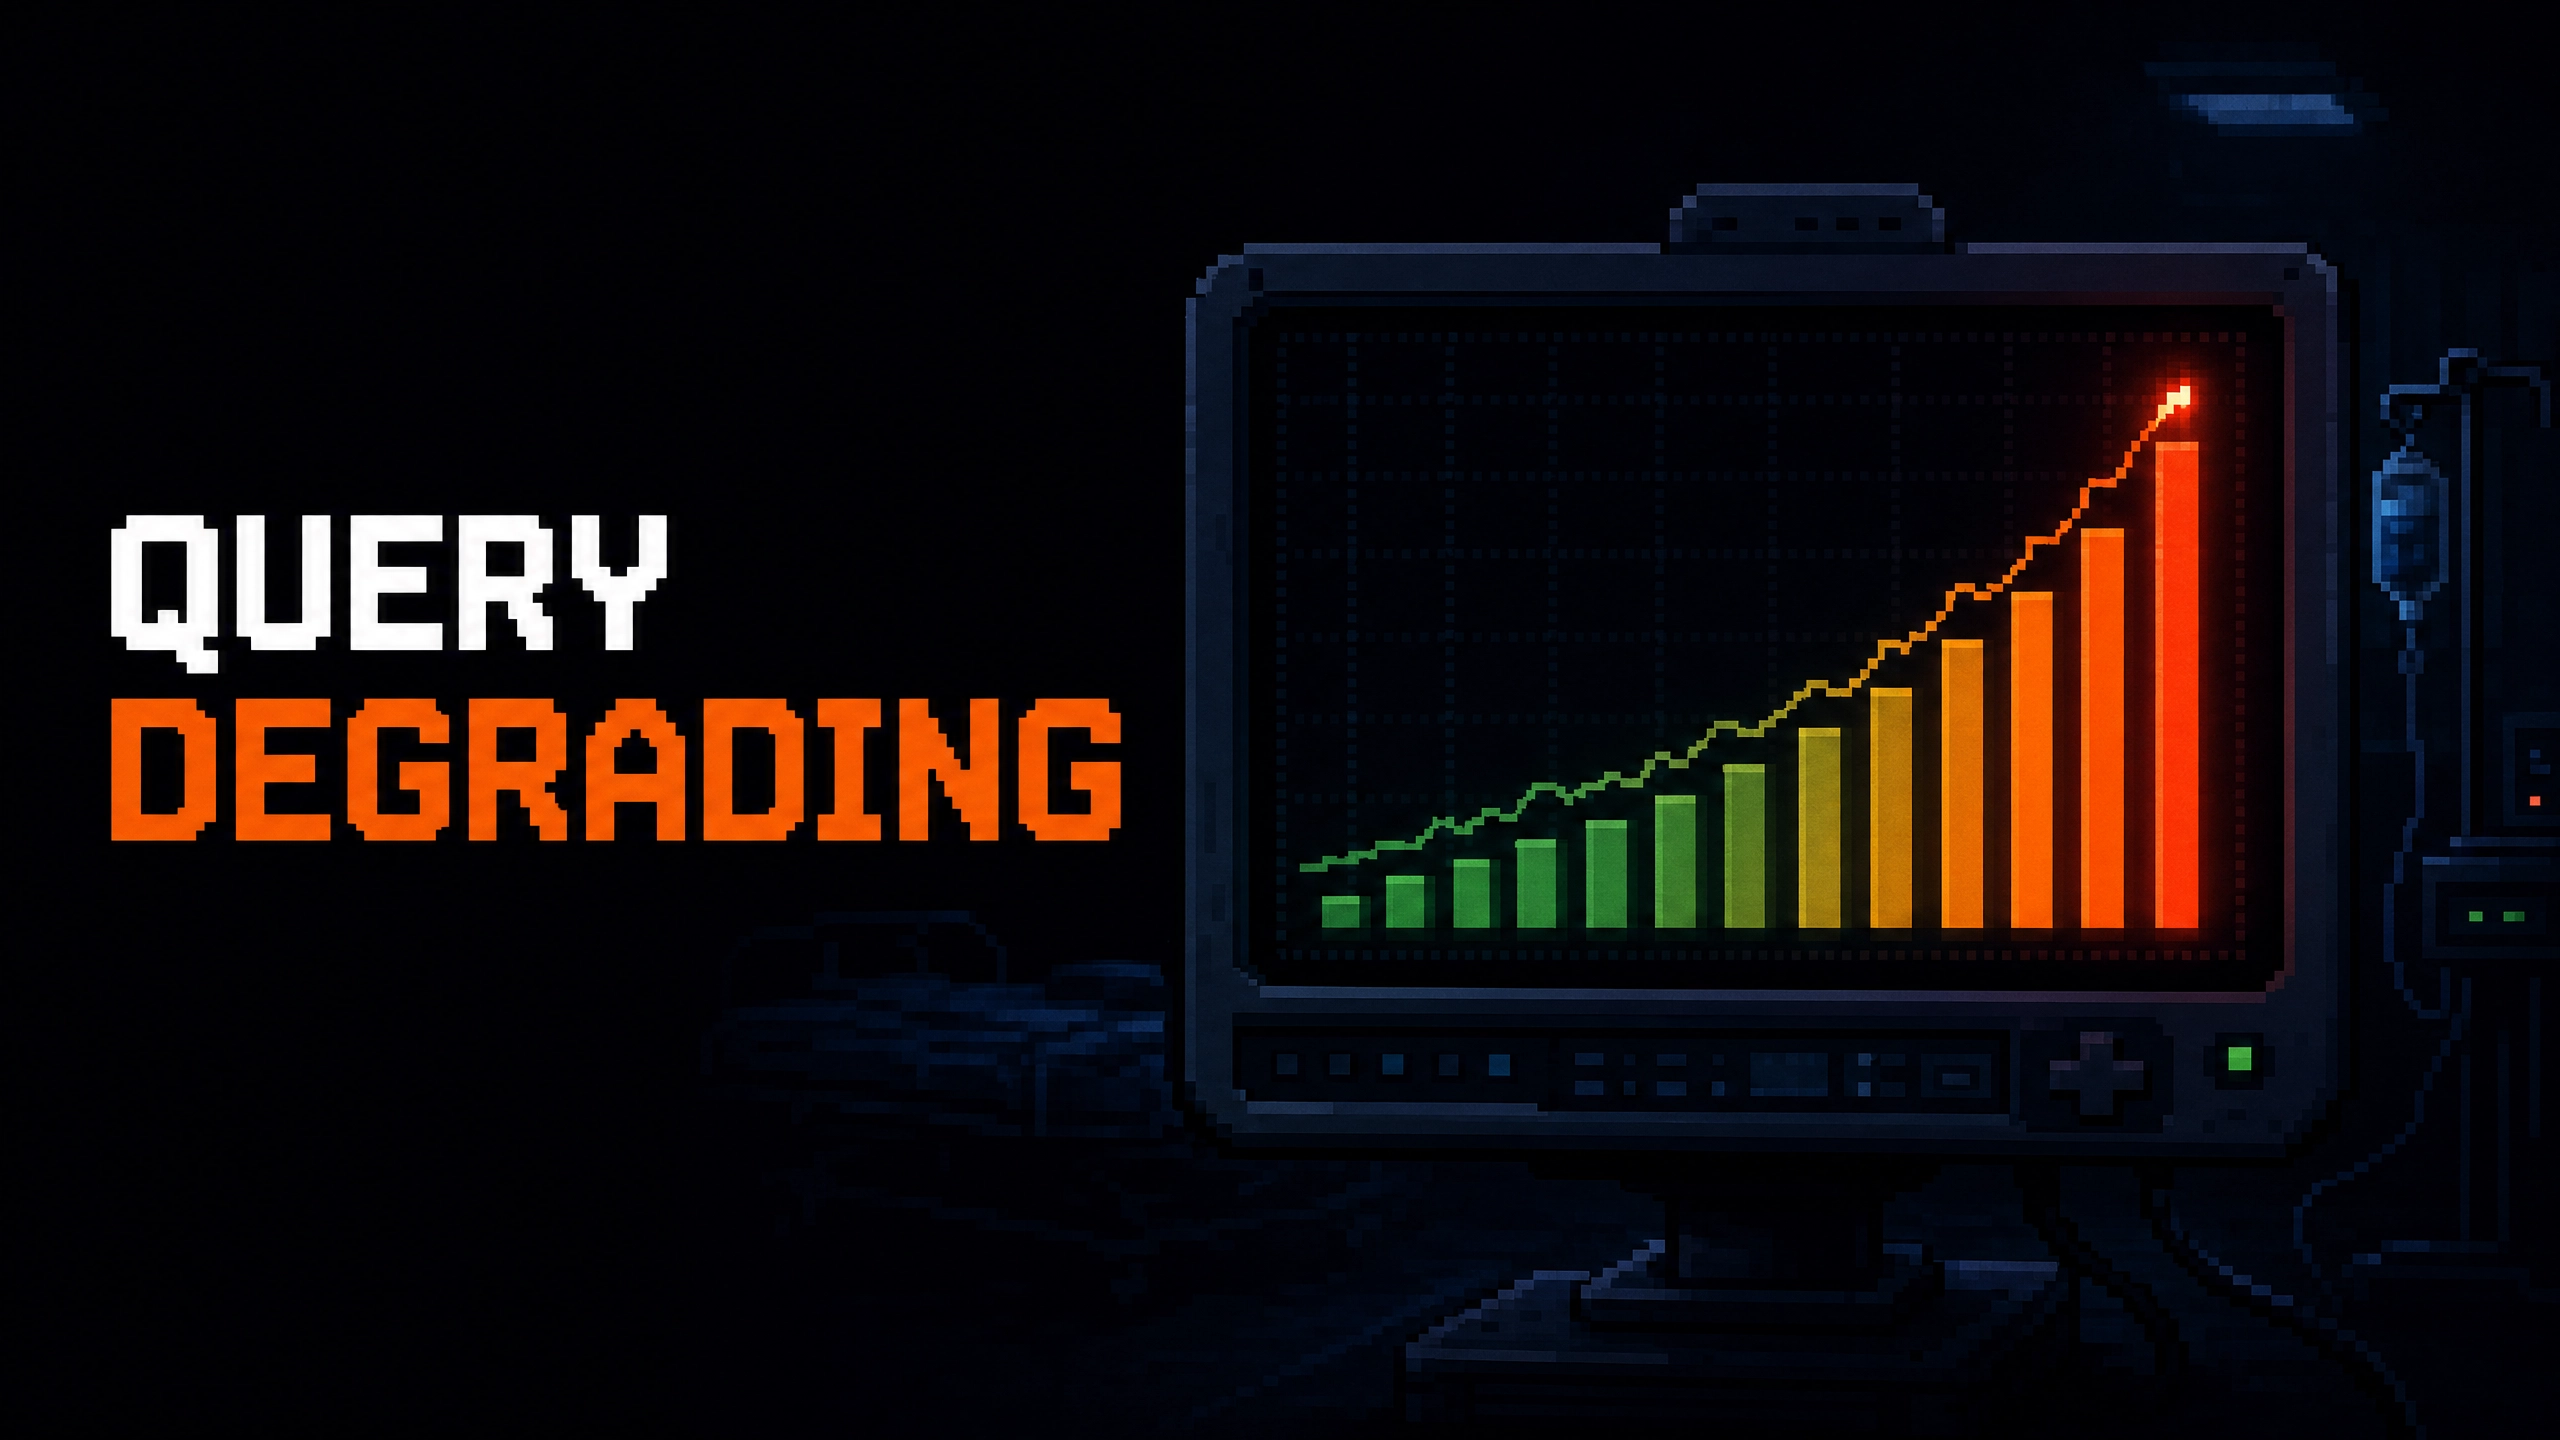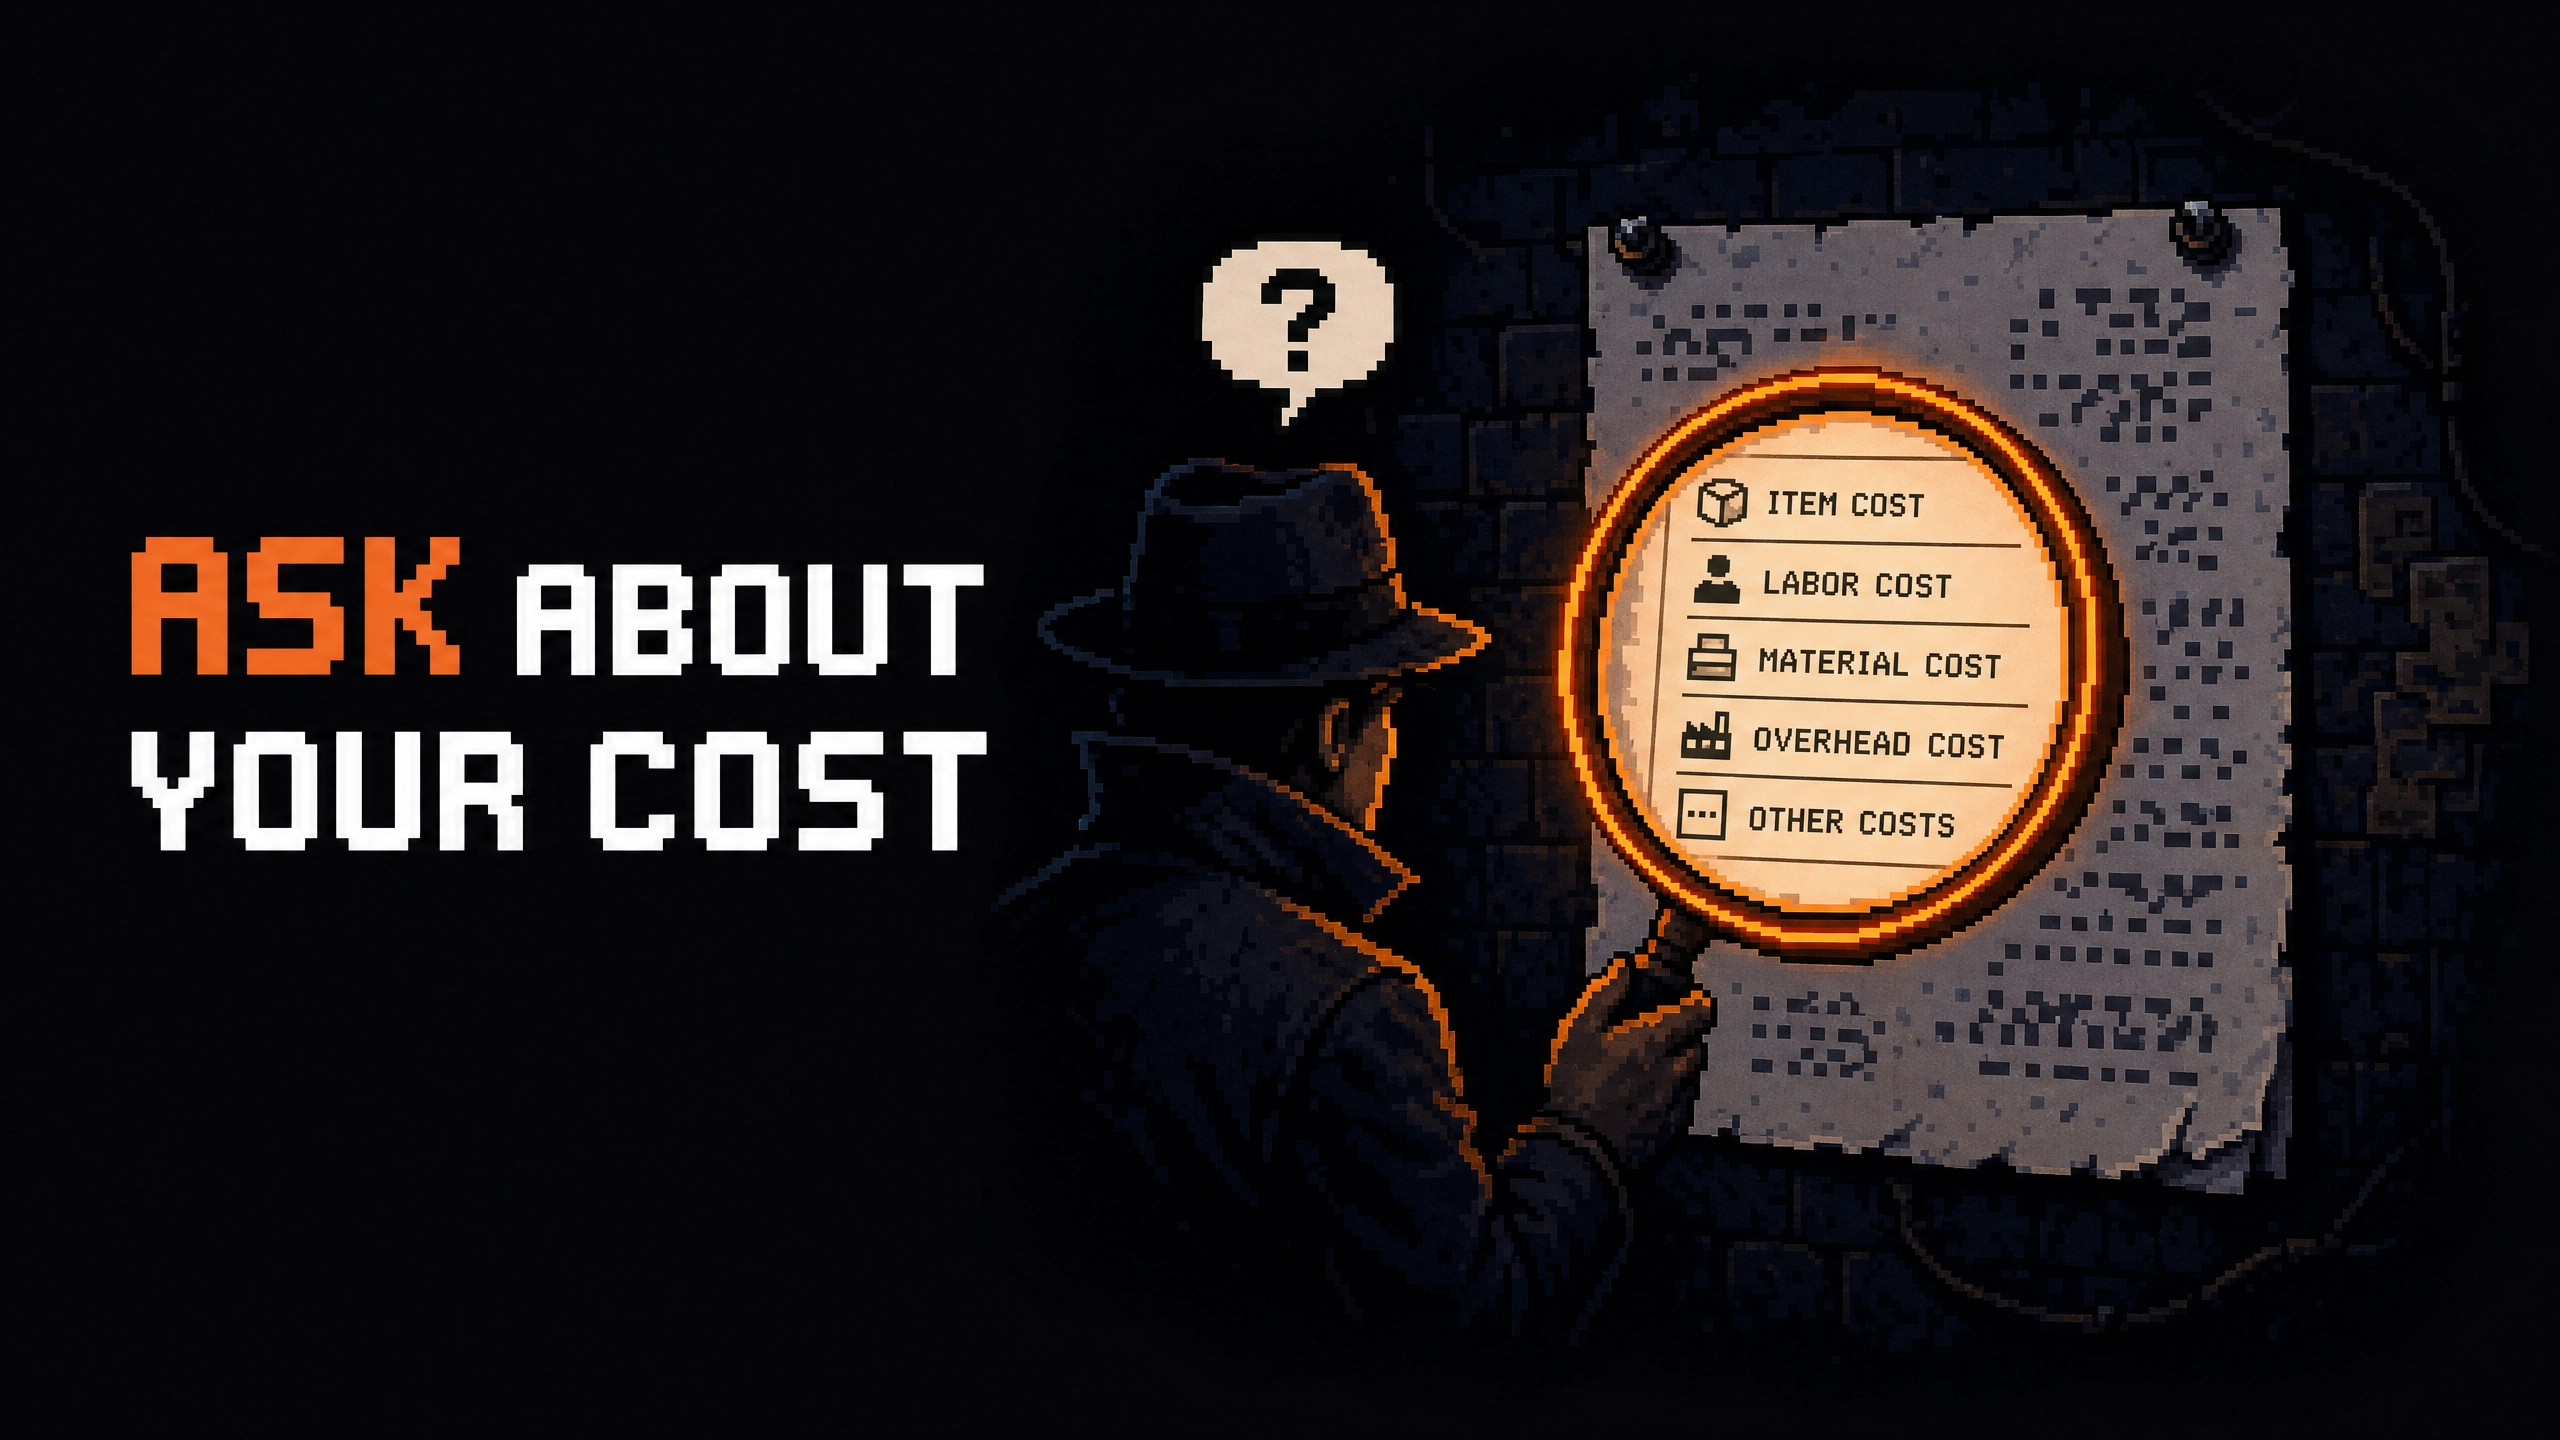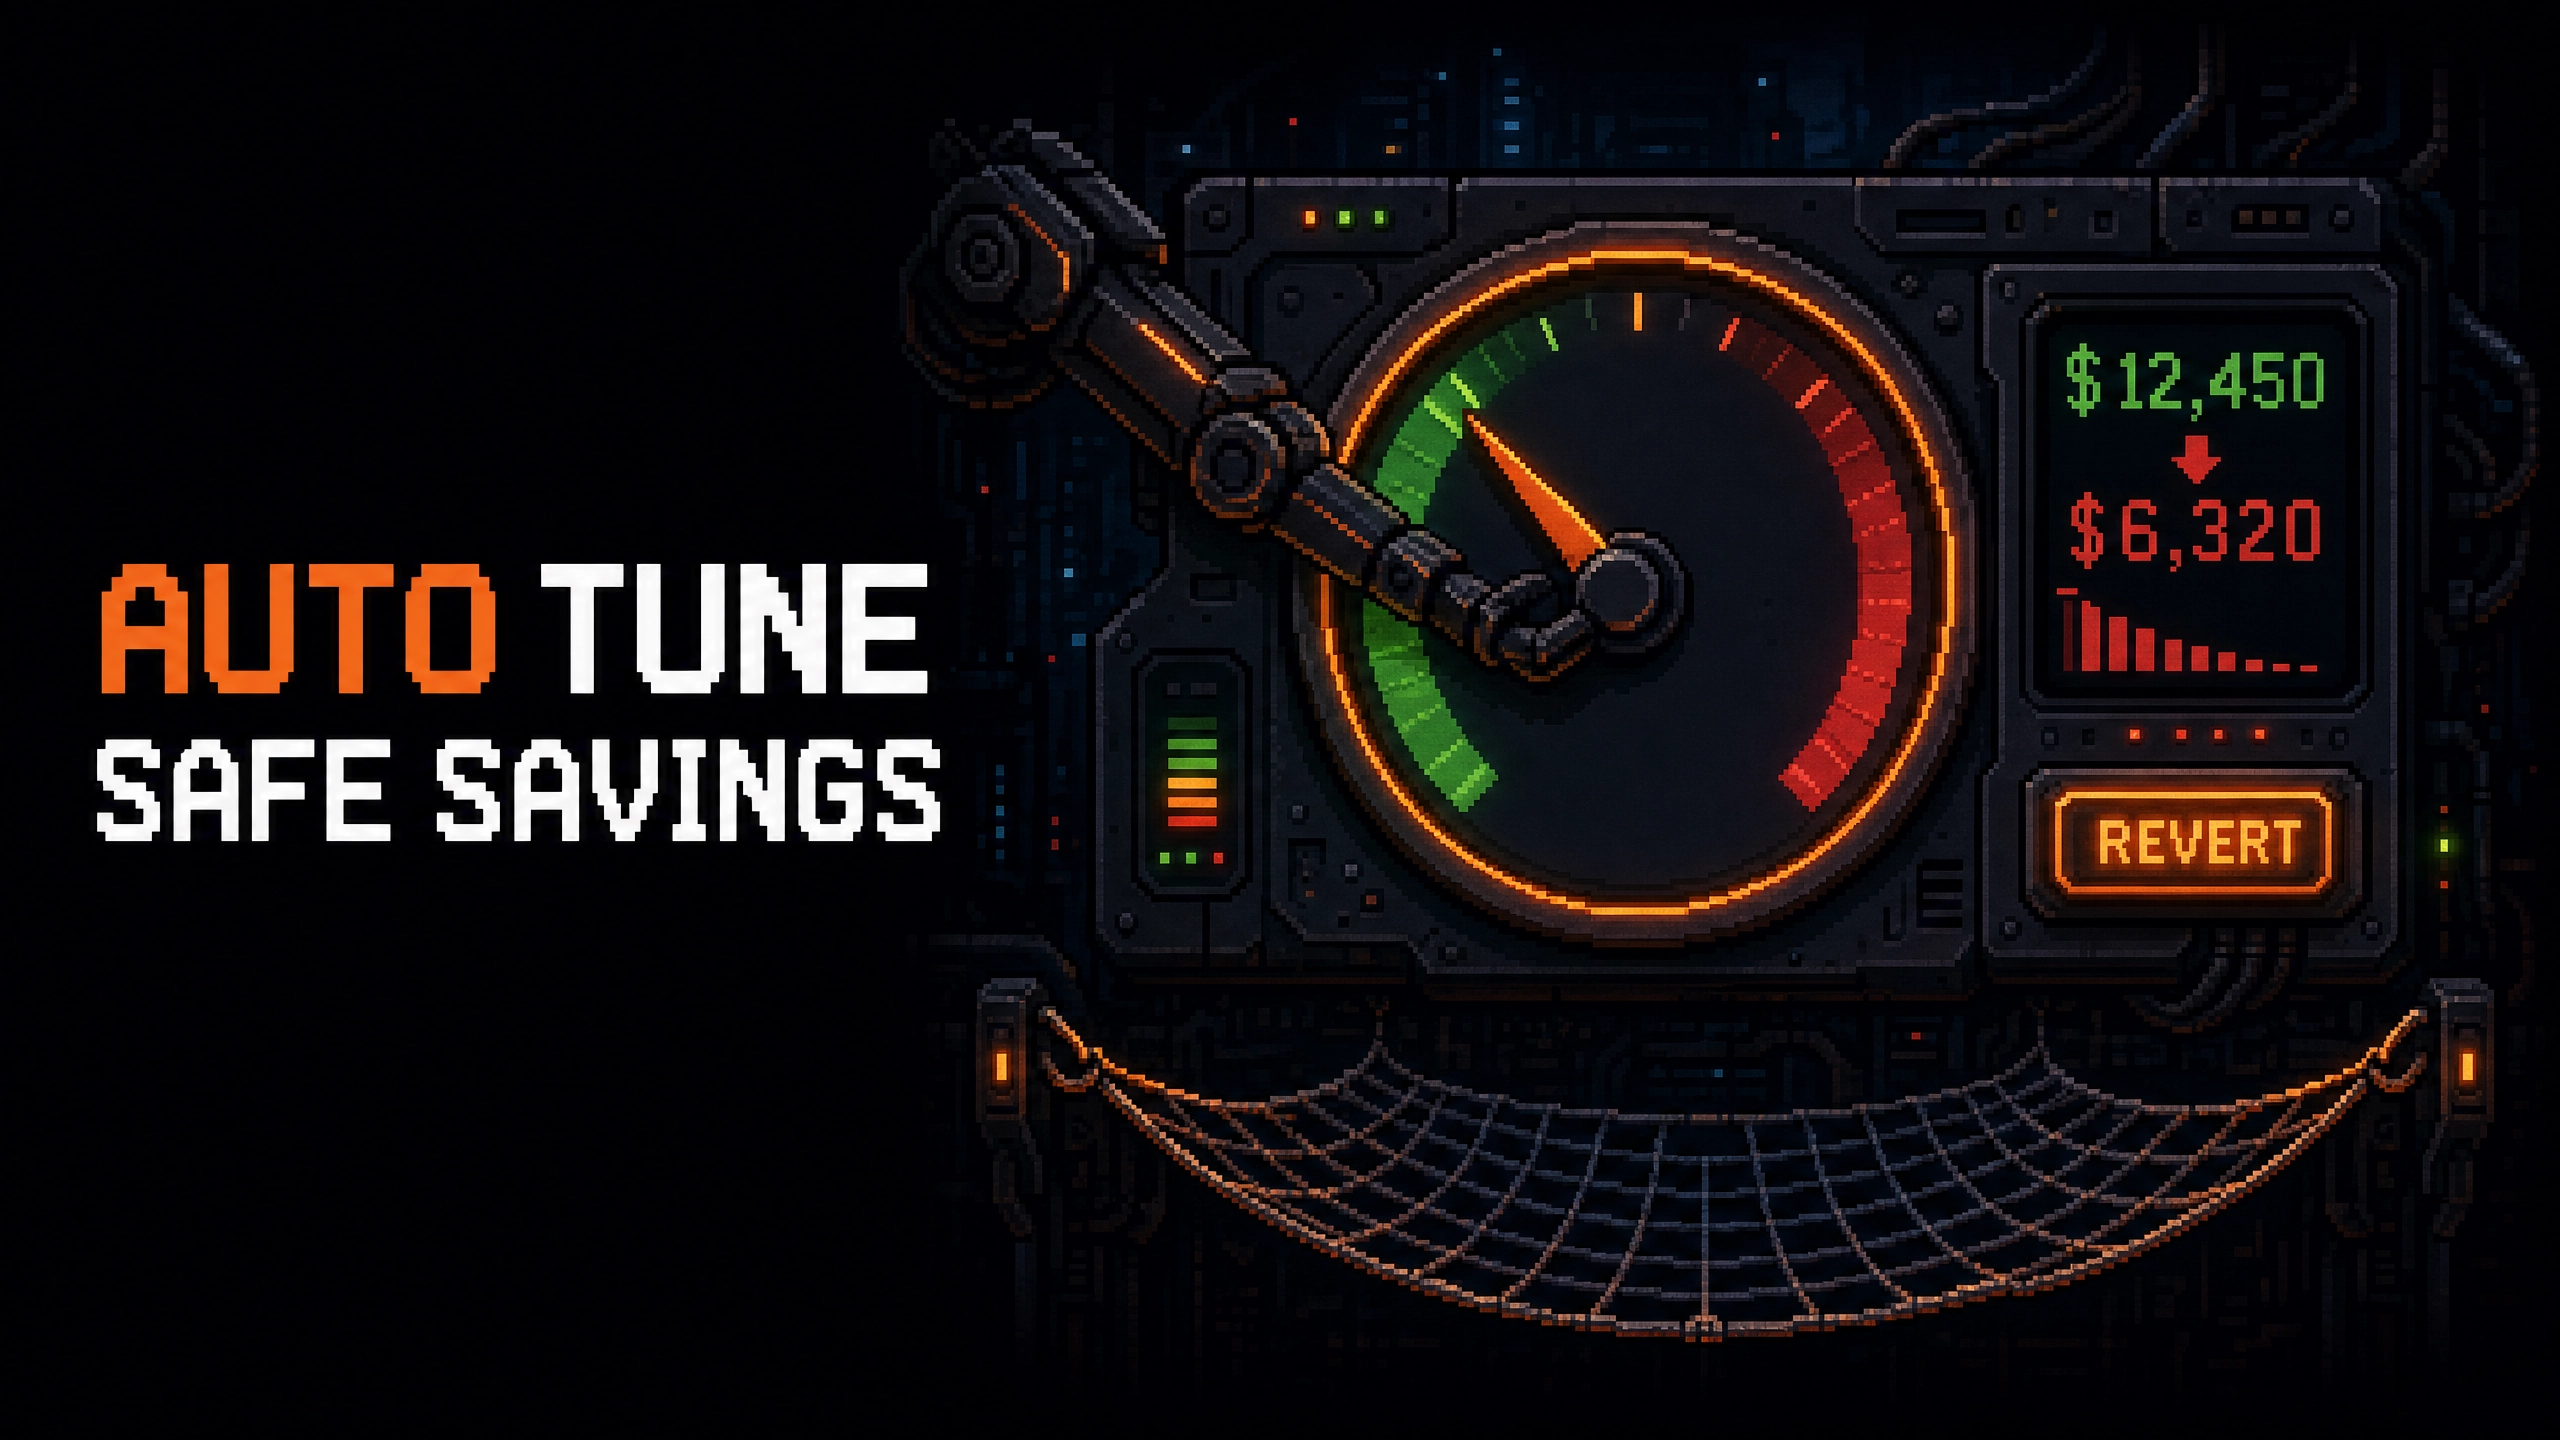
- Pain. When a workload runs slow or costs more, dbt, Tableau, and Snowflake each report their own piece of the story, but none of them says why, leaving the engineer to stitch the logs together by hand.
- Who it is for. Analytics engineers, data platform leads, and on-call engineers running dbt on Snowflake with Tableau.
- What it is. The Enterprise Platform reads dbt, Tableau, Snowflake, and notebook activity in one surface and names what changed when cost or duration moved.
Three Tools Plus A 2 A.M. Spike Is Not An RCA Plan
A subscription-analytics platform runs a nightly dbt job that lands data for a set of Tableau dashboards. On a Wednesday morning the dbt job took eighty minutes instead of its usual forty. The dashboards refreshed on time but on a warehouse that had been resized last week for a different reason. Somebody in the pipeline added a new incremental model. The on-call engineer spends an hour reading dbt logs, another hour cross-referencing Snowflake QUERY_HISTORY, and lands on a plausible theory that the team accepts because nobody has a better one.
The pattern is an RCA that lives in three different tools' logs. The workloads surface reads all three.
One Surface, Six Workload Types
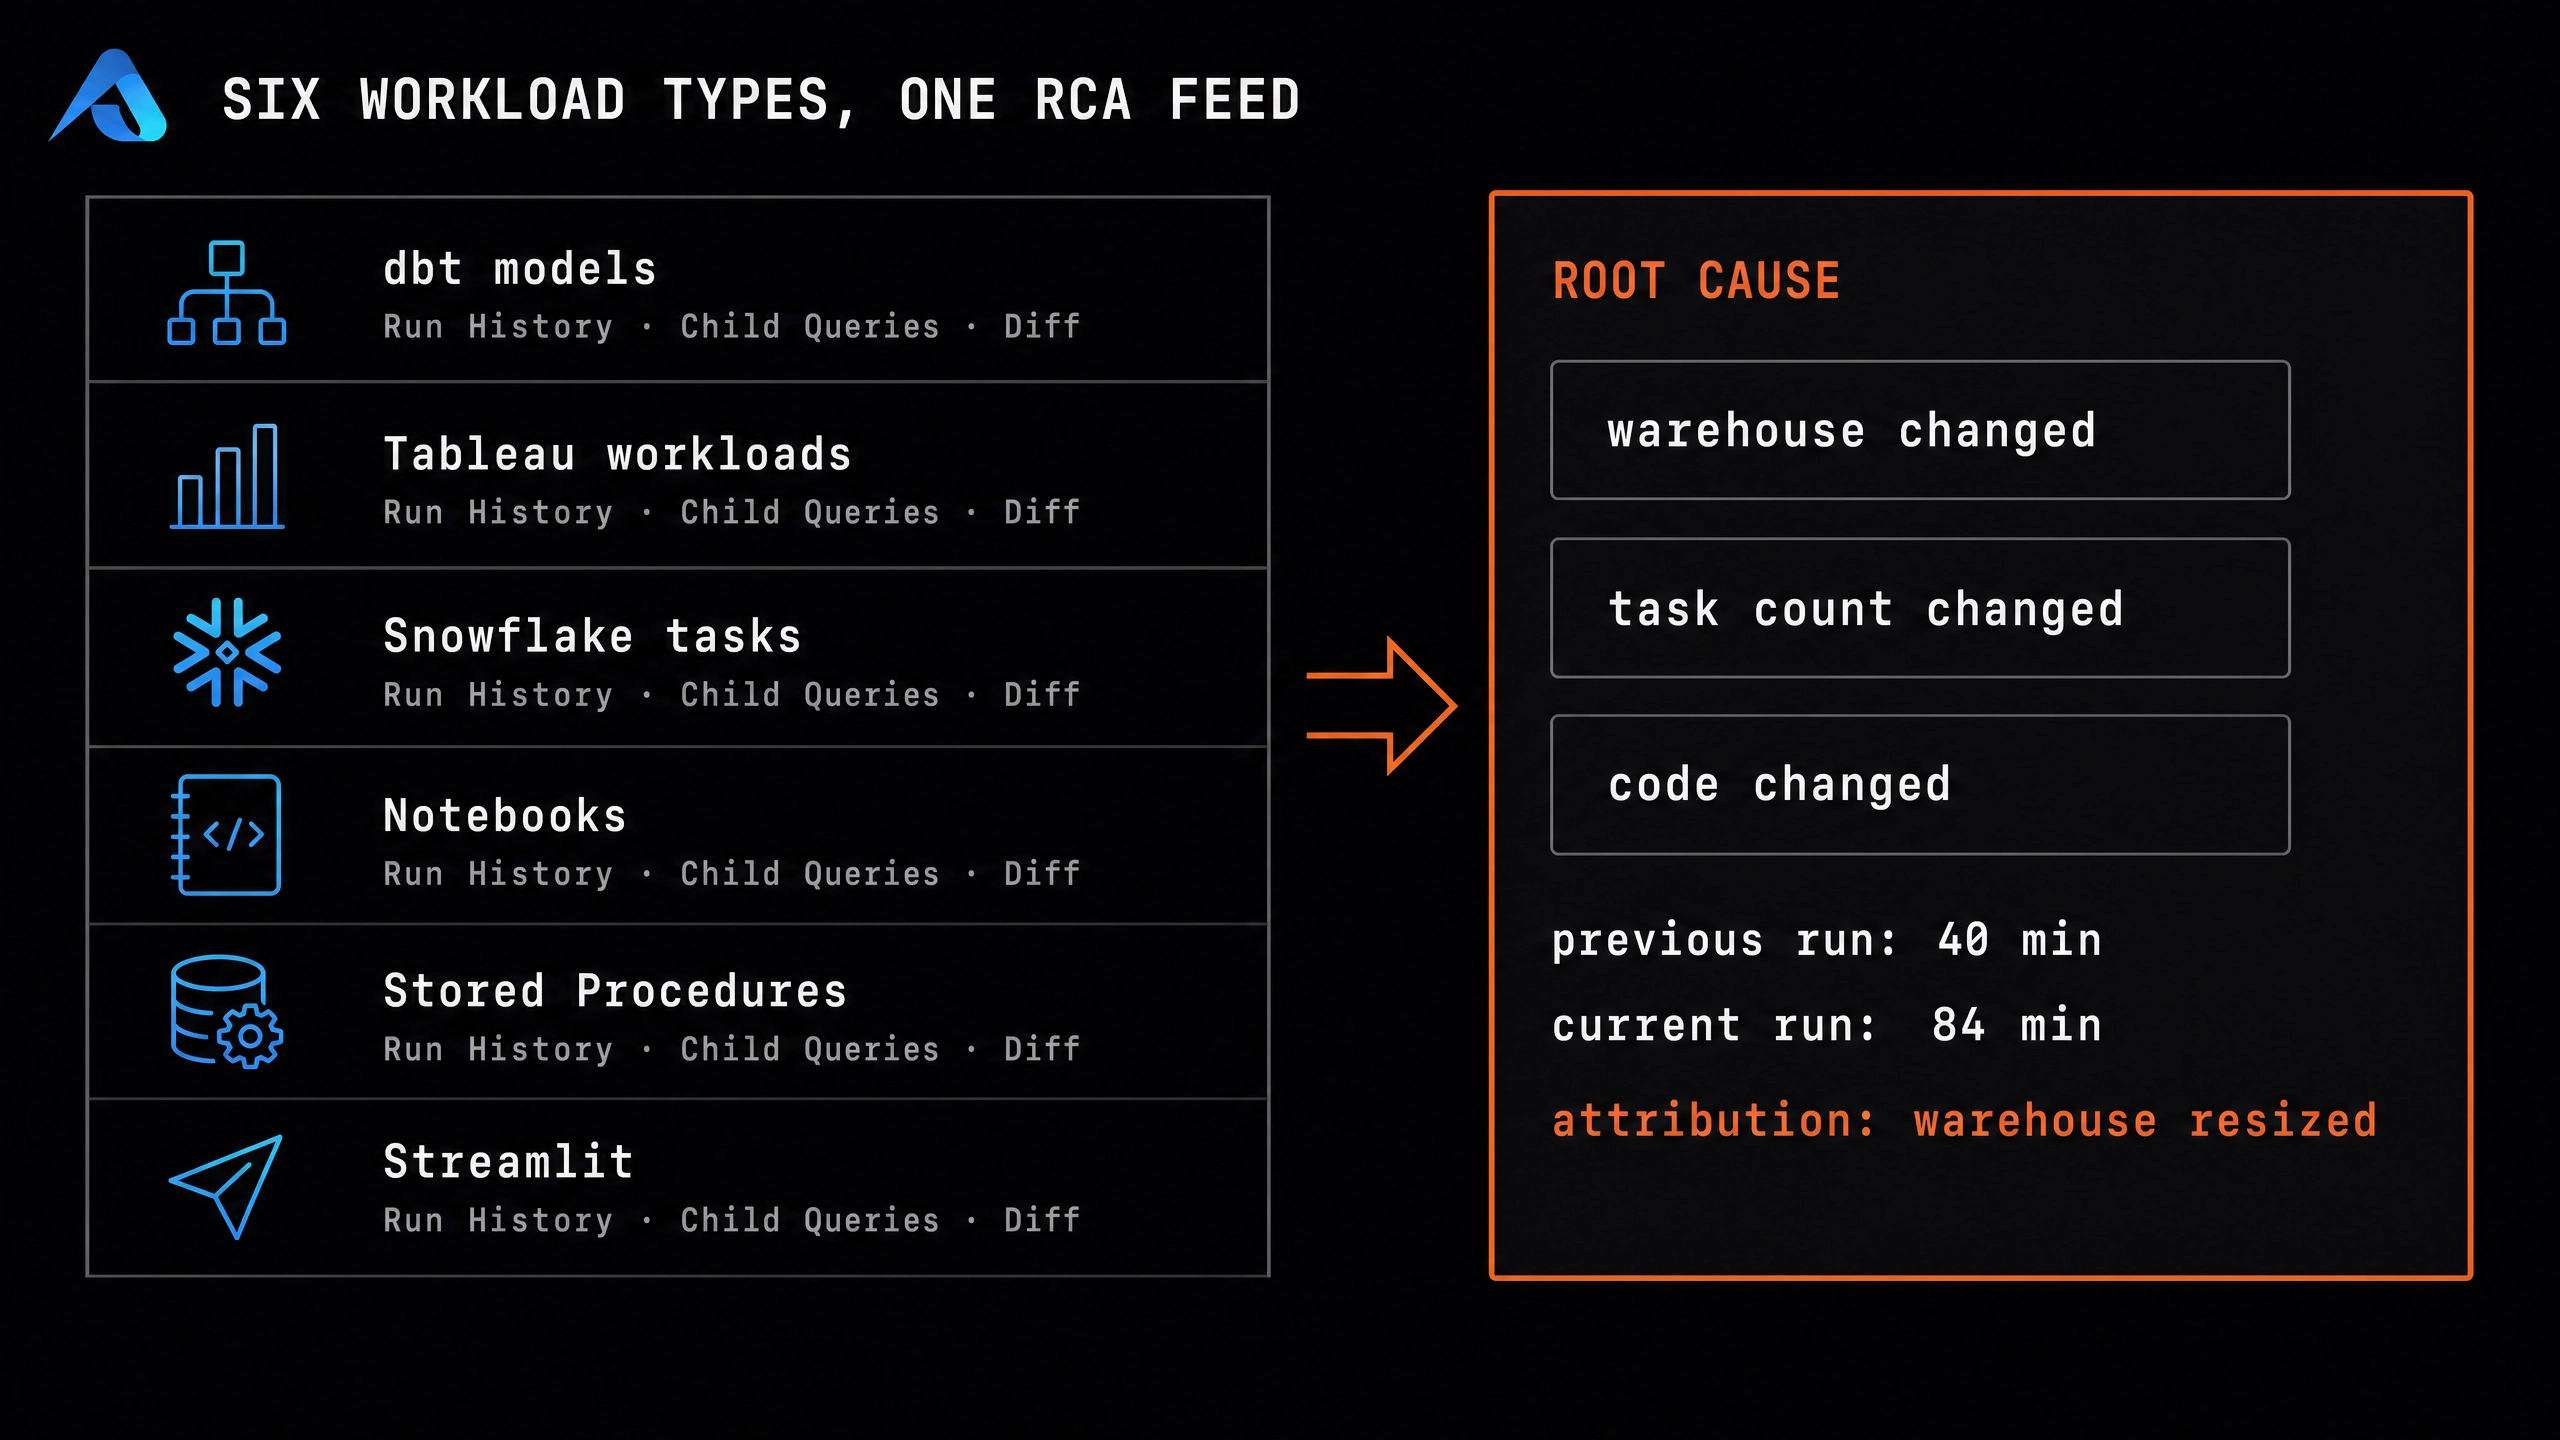
The Code section of the platform documents six workload types with their own cost, run history, and RCA feed:
| Workload type | Doc | RCA feed |
|---|---|---|
| dbt models | dbt models guide | per-model run history + upstream/downstream context |
| Tableau workloads | Tableau workloads guide | per-dashboard refresh and tagged-query history |
| Snowflake tasks | Workloads guide (generic surface) | per-task run history + child queries |
| Notebooks | Notebooks guide | per-notebook run history + child queries |
| Stored Procedures | Stored Procedures guide | per-procedure run history + child queries |
| Streamlit | Streamlit guide | per-app run history + child queries |
Every row is a real object on the customer's Snowflake account, and every row has a run history the platform can diff between runs. One surface, six workload types, one shape.
The AI Compares Runs Across Three Named Levers
The Workloads guide frames the RCA as "AI compares runs and identifies root cause of spikes/drops". The three levers the diff can attribute a spike to:
- Warehouse changes. Was the warehouse resized, its cluster count changed, or was the workload retargeted to a different warehouse between runs?
- Task count changes. Did the number of individual tasks in the workload change (a new dbt model added, a new query added to a stored procedure)?
- Code changes. Did the SQL, the model definition, or the notebook cell content change between the last good run and this one?
Three levers is not the whole universe of causes, but it covers the three that account for the vast majority of runbook-worthy RCAs. Everything else is downstream of one of the three: a new task count usually means a new code change; a warehouse resize usually means a cost policy change. Three levers because most RCAs land on one of the three.
The dbt Case Is Where The RCA Feed Is Most Valuable
A dbt run is easy to under-diagnose because the dbt CLI's own logs describe what ran but not the deep cost story. The platform's dbt-models workload reads the same dbt manifest and catalog artefacts and joins them against the Snowflake query cost side. The RCA output looks like: "the mart_subscriptions model took 3.4x longer this run because the stg_events upstream added 240 million rows this week, not because the warehouse changed". That is a diagnosis a dbt log alone would not surface. The dbt log describes the run; the platform describes the run in cost.
The Tableau Case Is Where The Tagged-Query Feed Matters
A Tableau dashboard refresh in isolation is opaque to the RCA. But once queries are tagged (via the Edit Initial SQL flow on the Tableau data source), the workload becomes a query set the platform can diff. When a dashboard's refresh cost jumps 4x on a Monday, the tagged-query feed shows the specific query that got expensive and the child queries beneath it. The Tableau refresh audit article covers the setup and the taxonomy that surrounds this. The tags turn a dashboard refresh into a diff-able workload.
What Lands When The RCA Stops Being A Stitch Job
One RCA surface across six workload types, all reading real Snowflake account data and real dbt / Tableau artefacts. Three attribution levers (warehouse change, task count change, code change) that cover the vast majority of runbook cases. Per-run child queries so the finding names the specific query that got expensive. The query degradation article covers the query-level zoom; this article is the workload-level zoom. The paste-a-query-ID rewrite article covers the fix once the RCA has named the culprit query. One RCA feed replaces three log dives.