- Pain. Answering "why did our warehouse bill jump" takes a morning of dashboard-hopping and Slack pings for a plain-English answer, and by the time it arrives, the meeting it was needed for has already happened.
- Who it is for. Data platform leads, engineering managers, and finance partners needing answers to warehouse-cost questions.
- What it is. Altimate Studio answers warehouse-cost questions in plain English and cites the table, query, and computation behind every number.
"Where Did This $40K Come From" Is The Wrong Question To Take To Five Dashboards
A retail-data platform lead opens Monday's cost dashboard and sees the week's Snowflake spend up 40%. The Cortex line item is roughly the increase. The lead's hunt: open the Cortex AI Services dashboard, scan the four usage types, copy a number into a sheet. Open the Workloads dashboard, filter by the most-active tag. Open the warehouse dashboard for the affected warehouse, look at concurrent activity. Slack the data-ops engineer who manages the Cortex pipelines. Wait. Reconcile the numbers. Two hours later, the answer ("the new prompt template on the customer-onboarding pipeline doubled the per-call token count") is in a message and the receipts are scattered across four dashboards.
The pattern is the same on every cost question. The answer exists; the receipts exist; the work is in stitching them. A Studio session that takes the plain-English question and answers it with cited numbers is the right shape of tool.
Four Cost Domains, One Studio Thread
Studio's cost analysis spans four domains in the same thread, not warehouses alone:
| Domain | What Studio breaks the answer down by | Where it matters |
|---|---|---|
| Warehouses | per-warehouse credits, concurrent activity, query-cost questions | the existing baseline |
| AI Services | per-function across the four usage types (AI services, AI inference, overage variants) | Cortex bills; named function or feature drives the spend |
| Serverless | 19+ usage types with per-table clustering drilldown and dynamic-table refresh tracking | which serverless line item came from clustering, refresh, or another internal job |
| Workloads | by workload tag (matching the Workloads page) | which team or pipeline drove the cost |
The same Studio thread now spans the four domains. The platform lead's "where did this $40K come from" question gets answered across all four without context-switching between dashboards. One conversation, the whole bill.
Studio also carries Code-workloads context: opening it from Snowflake Jobs, Notebooks, Streamlit, or Stored Procedures pages picks up the workload identifier automatically, so "why is this notebook slow" or "what does this stored proc cost" has the right anchor.
Inline Citations Turn The Answer Into Receipts
Studio adds inline data provenance. Every significant number in a Studio answer carries a small marker; click it to see:
- the data source (which table the number came from)
- the query that produced it
- the computation steps used to derive it (sums, joins, group-bys, the lot)
The annotations are produced by a separate analysis pass that runs after the answer is generated, so the answer text is never rewritten. The lineage you see in the popover matches what the model actually computed. Numbers the model cannot trace (model commentary, narrative summaries) carry no marker, which makes the cited values stand out.
The answer is not "trust me"; the answer is "click the marker".
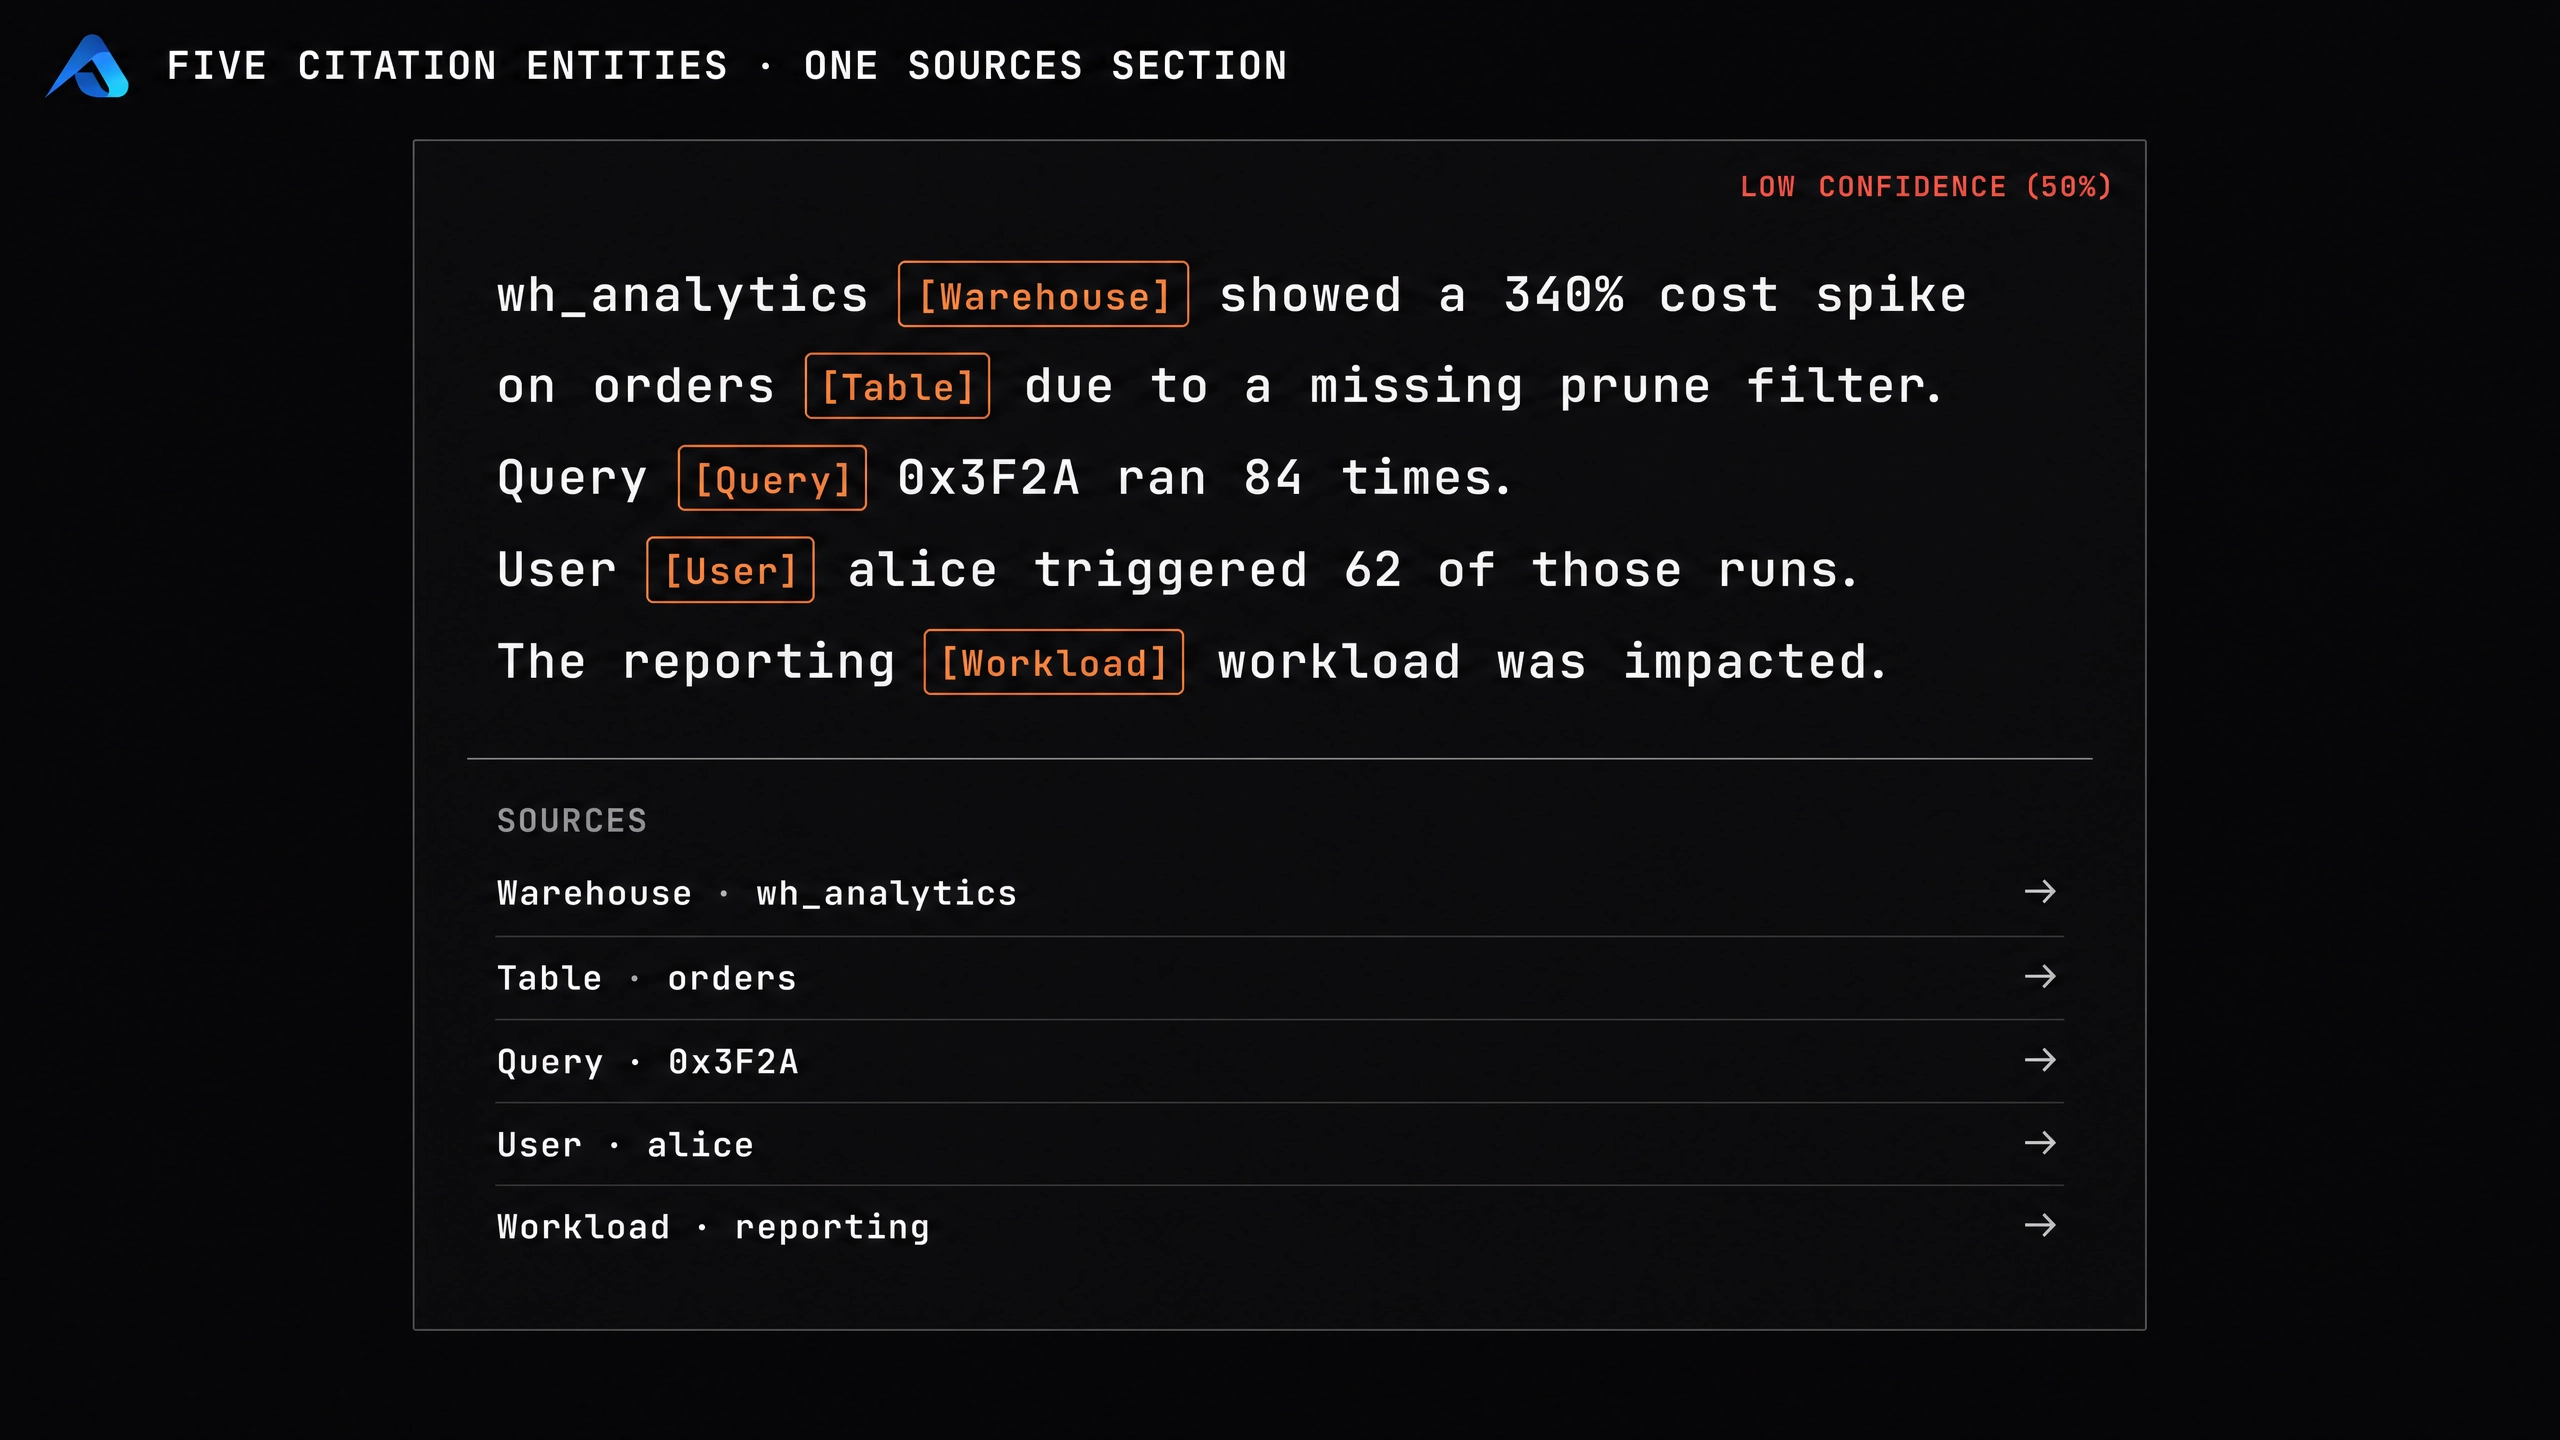
A worked Studio output:
The Cortex bill increased $24,840 last week, driven by the
ai_inference [marker:1] line item on the customer-onboarding
pipeline [marker:2]. Per-call token count roughly doubled
from ~1,800 to ~3,650 [marker:3] on Apr 14, matching the
deploy of the new prompt template.

[marker:1] → SNOWFLAKE.ACCOUNT_USAGE.METERING_HISTORY,
            filtered to service_type='AI_SERVICES'
[marker:2] → JOIN to QUERY_HISTORY on query_tag.pipeline
[marker:3] → average of TOKEN_COUNT per query, by week
The platform lead takes the cited values to finance; the engineer follows the marker to audit the math; the team reaches consensus instead of debating numbers.
Shareable Links And Scheduled Reports Turn The Session Into An Artifact
Two surfaces sit on top of the cited answer:
| Surface | What it does |
|---|---|
| Shareable link | a time-limited read-only URL to the Studio session; anyone with access can open it, citations and all |
| Schedule action | turns any Studio conversation into a recurring email report; pick a cadence, pick recipients, the same analysis lands in their inbox each week with fresh data and inline charts |
The lead's $40K question becomes a Slack-able link to the cited answer for the finance partner, plus a weekly "Cortex cost breakdown" report that lands in the head of FinOps's inbox without anyone clicking refresh.
The Spark Analyst Agent Traces A Databricks Job To The Task
For Databricks teams, Studio ships the Spark analyst agent. Ask Studio about a slow or failed Databricks run and the agent:
| What it does | What it returns |
|---|---|
| Trace from app level down to individual tasks | the task that took the longest and the stage it was in |
| Correlate stage-level performance back to source | the notebook and the cell that produced the slow stage |
| Call out query-plan optimisation flags | the specific Spark hints that would help |
| Surface node-level CPU / memory utilisation | which executor saturated which resource |
Four metadata tables (dbx_spark_code_context, dbx_spark_task_runs, and the others) capture the data the agent reasons over, populated by a task-runs endpoint on the backend. These tables are the foundation the Spark analysis surfaces build on.
For a Databricks team's "this job got slower this month" question, the answer arrives with the task name, the cell that drives it, and the recommended fix. From app to task, cited.
What Studio Cost Analysis Replaces And What To Wire Next
The four-domain coverage replaces the dashboard-hopping investigation. The inline citations replace the "do we trust the AI's number" debate. The shareable links replace the screenshot. The scheduled reports replace the weekly email someone has to copy together by hand. The Spark analyst agent replaces the manual notebook-to-task trace for Databricks teams. The Code-workloads context loading turns the Notebooks/Stored-Procs pages into Studio entry points.
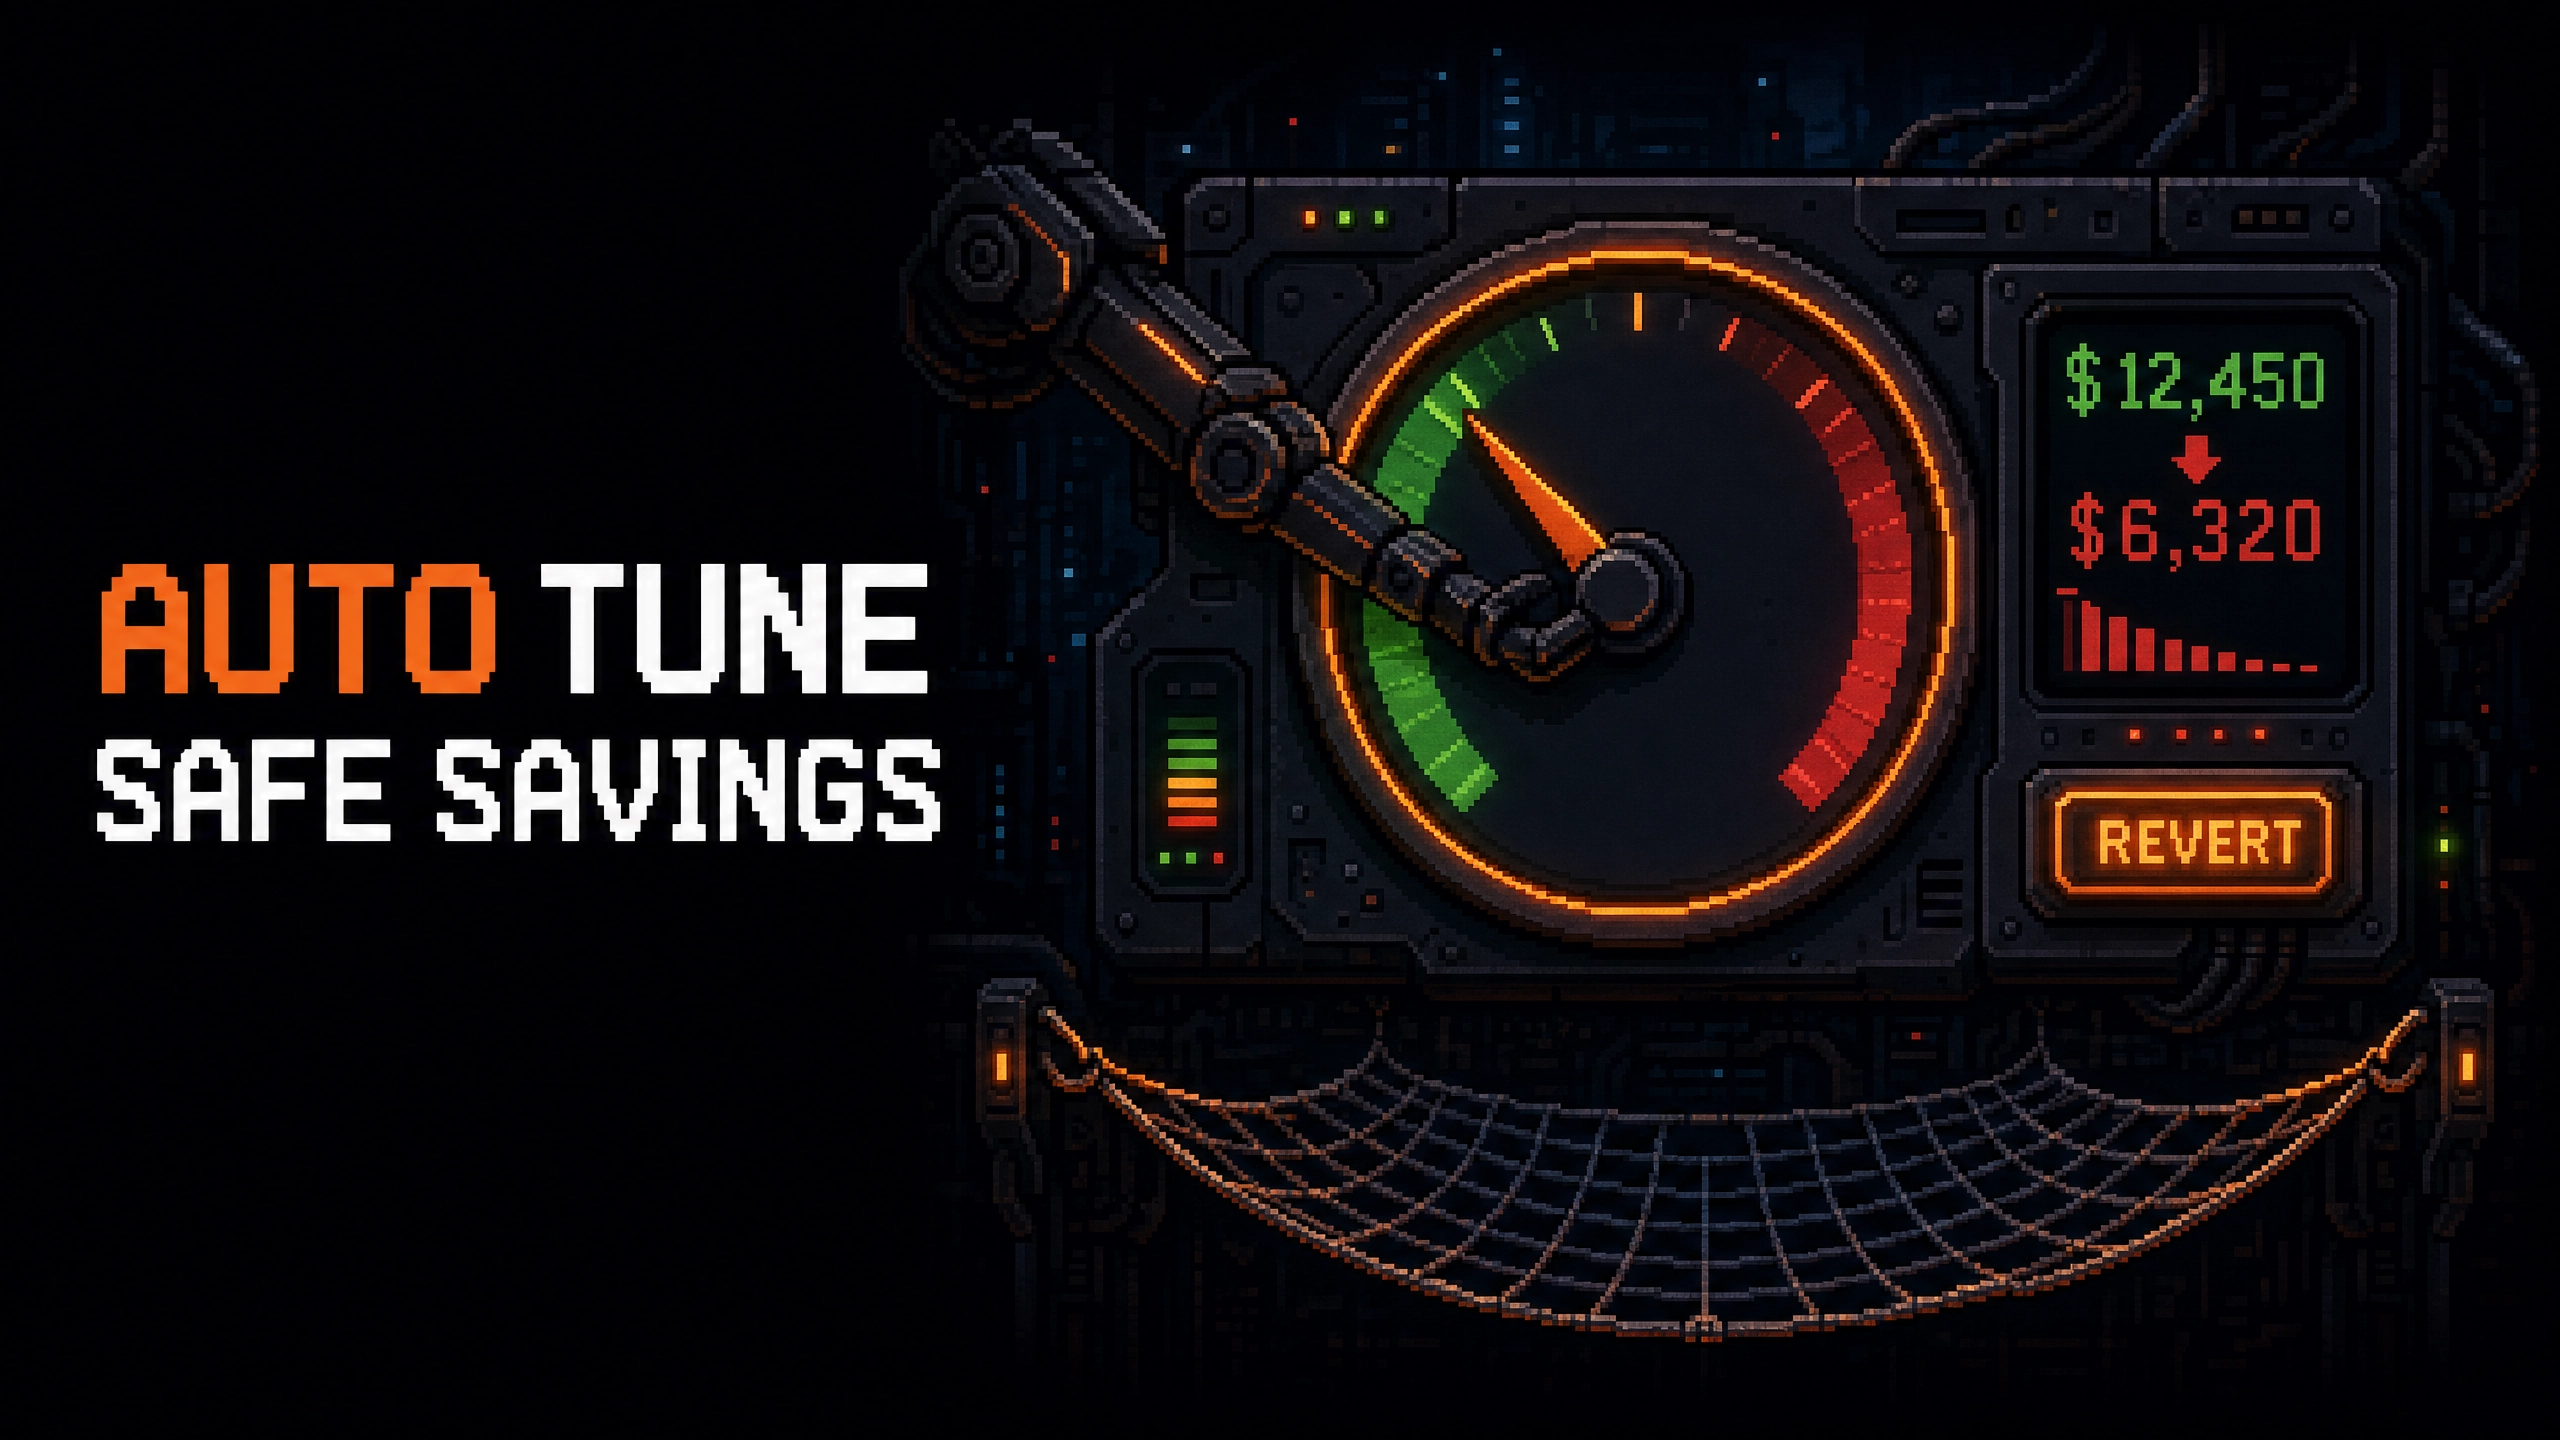
The companion articles on Auto Tune (sizing), warehouse scheduling (calendar), Query Timeout Prediction (runtime alerts), and the cross-warehouse cost agent (IDE-side investigation) cover the action layers; Studio is the investigation layer that explains what the action layers changed.
A Cost Surface The Finance Partner Can Read
Studio's plain-English cost analysis is the layer that connects the cost-control mechanics to the people who care about the cost. The inline citations close the trust gap. The four-domain coverage closes the surface gap. The shareable links and scheduled reports close the artifact gap. The Spark analyst agent closes the Databricks-specific gap. The Code-workloads context closes the surface gap on Snowflake's job-shaped pages. One thread, four domains, citations on every number, an artifact the team can ship.