- What it is. A Profile Query button in the Query Results panel that costs one click and no new setup. It hands your compiled SQL to Altimate Code, which runs your warehouse's own EXPLAIN and reads the plan back to you.
- Who it is for. Analytics engineers who own a dbt model that got slower and cannot read a query plan.
- What you get. The reason a slow dbt query is slow, in words, without learning your warehouse's plan format.
Your warehouse already knows why your model is slow. Before it runs anything, it works out a plan. The plan names the tables to read, the join strategy to use and the data each step scans.
That plan comes back as hundreds of lines of nested operators written for a database engineer, so almost nobody asks for it.
So you end up guessing why a model is slow. Rewrite a CTE, move a filter earlier, try an incremental. When that fails, you still do not know why.
Click Profile Query When Your dbt Model Runs Slow
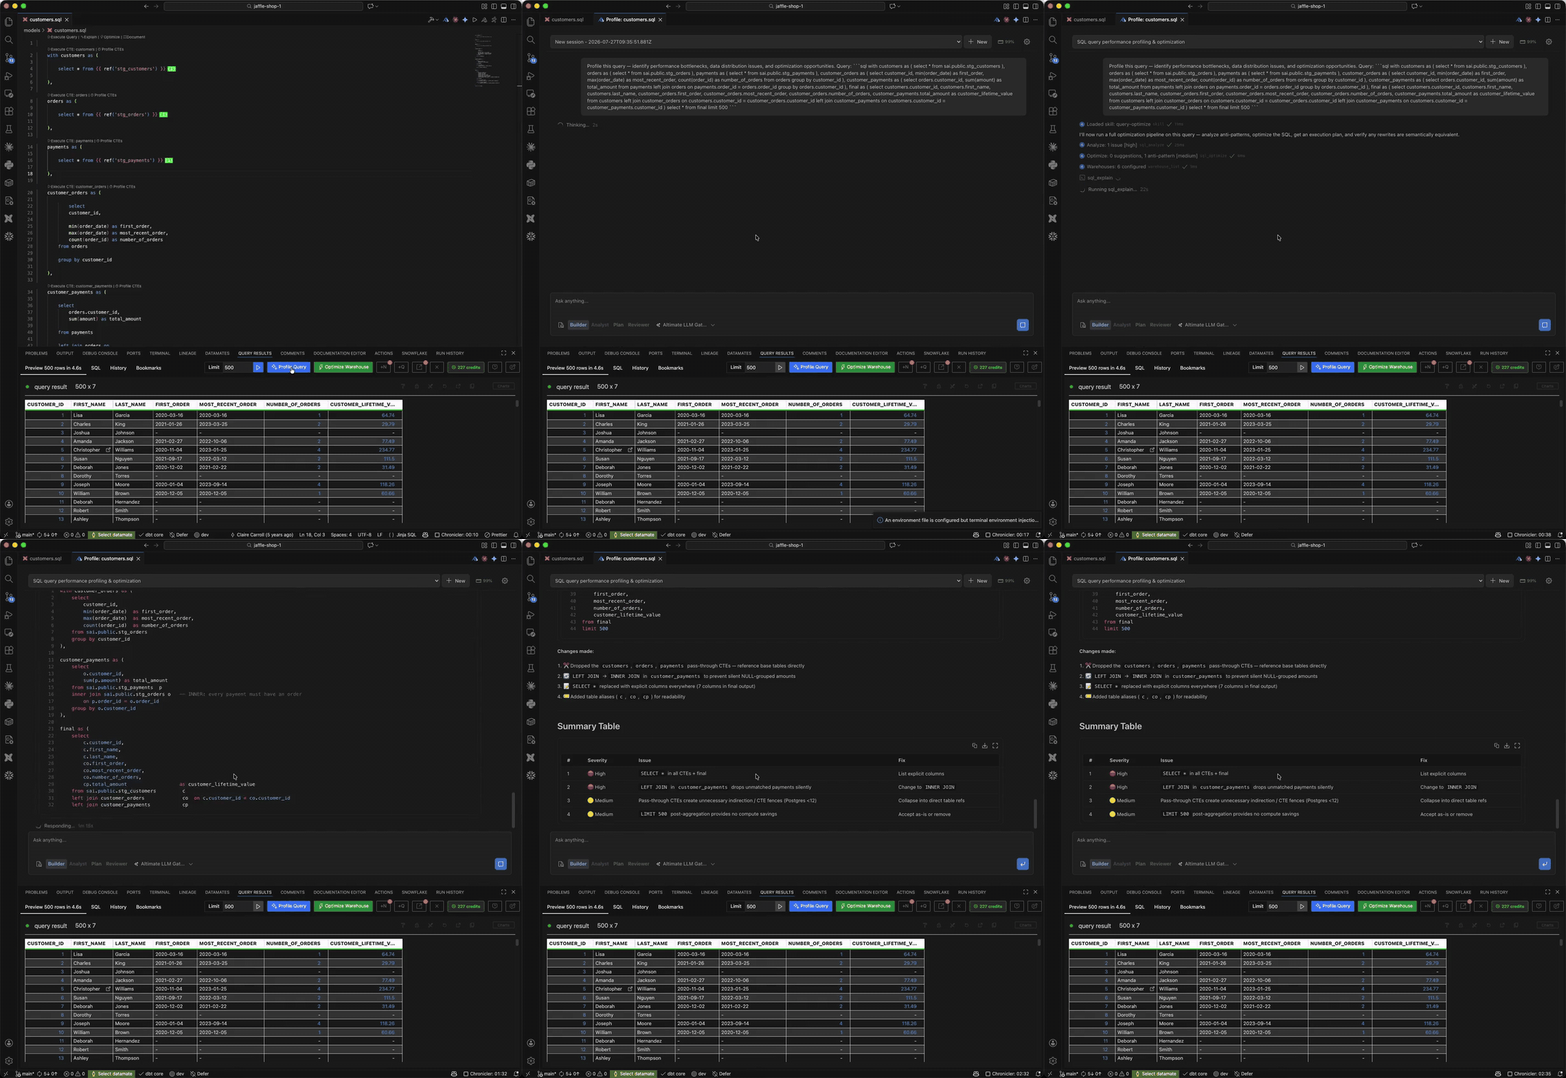
Run the query the way you already do, with Cmd+Enter on a Mac or Control+Enter elsewhere. Once results come back, a Profile Query button becomes available in the Query Results toolbar. It appears only when there is data to profile.
Clicking it opens an Altimate Code chat titled after the file you were in, carrying your SQL and a fixed instruction. That instruction asks for three things:
- Performance bottlenecks. Which step your query spends its time in.
- Data distribution issues. Skew or volume the plan did not expect.
- Optimization opportunities. What to change, and where.
The SQL it sends is the compiled query. It falls back to the raw text only when no compiled version exists.
A ref() says nothing about how much data gets read. The compiled query is what your warehouse actually ran.
The button becomes available on a customers.sql query that returned 500 rows in 4.6 seconds.
Altimate Code Runs EXPLAIN Against Your Own Warehouse
Profiling answers questions a chatbot cannot, because Altimate Code holds a live warehouse connection. Its sql_explain tool runs EXPLAIN on a query and returns the execution plan. Use it to diagnose slow queries, find full table scans and work out join strategies.
EXPLAIN returns the plan the warehouse intends to follow, and its estimate of how many rows each step produces. EXPLAIN ANALYZE goes further and runs the query for real. That is how you catch a step that expected a hundred rows and got four million.
Snowflake does not support EXPLAIN ANALYZE. On Snowflake you read the plan and its estimates instead. So the numbers you get there are a forecast rather than a measurement.
Two limits come from the tool itself, so they apply wherever you run it:
- A warehouse connection is required. Profiling reads a real plan from a real database. With nothing configured there is nothing to read.
- Values have to be inlined. Profiling cannot explain a query that still holds a placeholder like
?,:nameor$1. Nothing supplies the value. Compiled dbt SQL normally satisfies this already.
Pick Explain When You Have Not Run the Query Yet
Two Altimate Code buttons answer different questions.
| Button | How you reach it | What it answers |
|---|---|---|
| Explain with Altimate Code | The SQL tab | What does this query do? It reads the code in your editor, or the part you selected, and describes the logic |
| Profile Query | The Query Results toolbar, after a run | How does this query perform here? It reads diagnostic output from your warehouse |
Explain never touches your data, which makes it the right call on a teammate's model you are reviewing. Profile needs a run and a connection, and pays you back with facts about your data.
On customers.sql, Explain maps all seven columns back to their source staging model. It also places the model at the end of the DAG, behind three staging models.
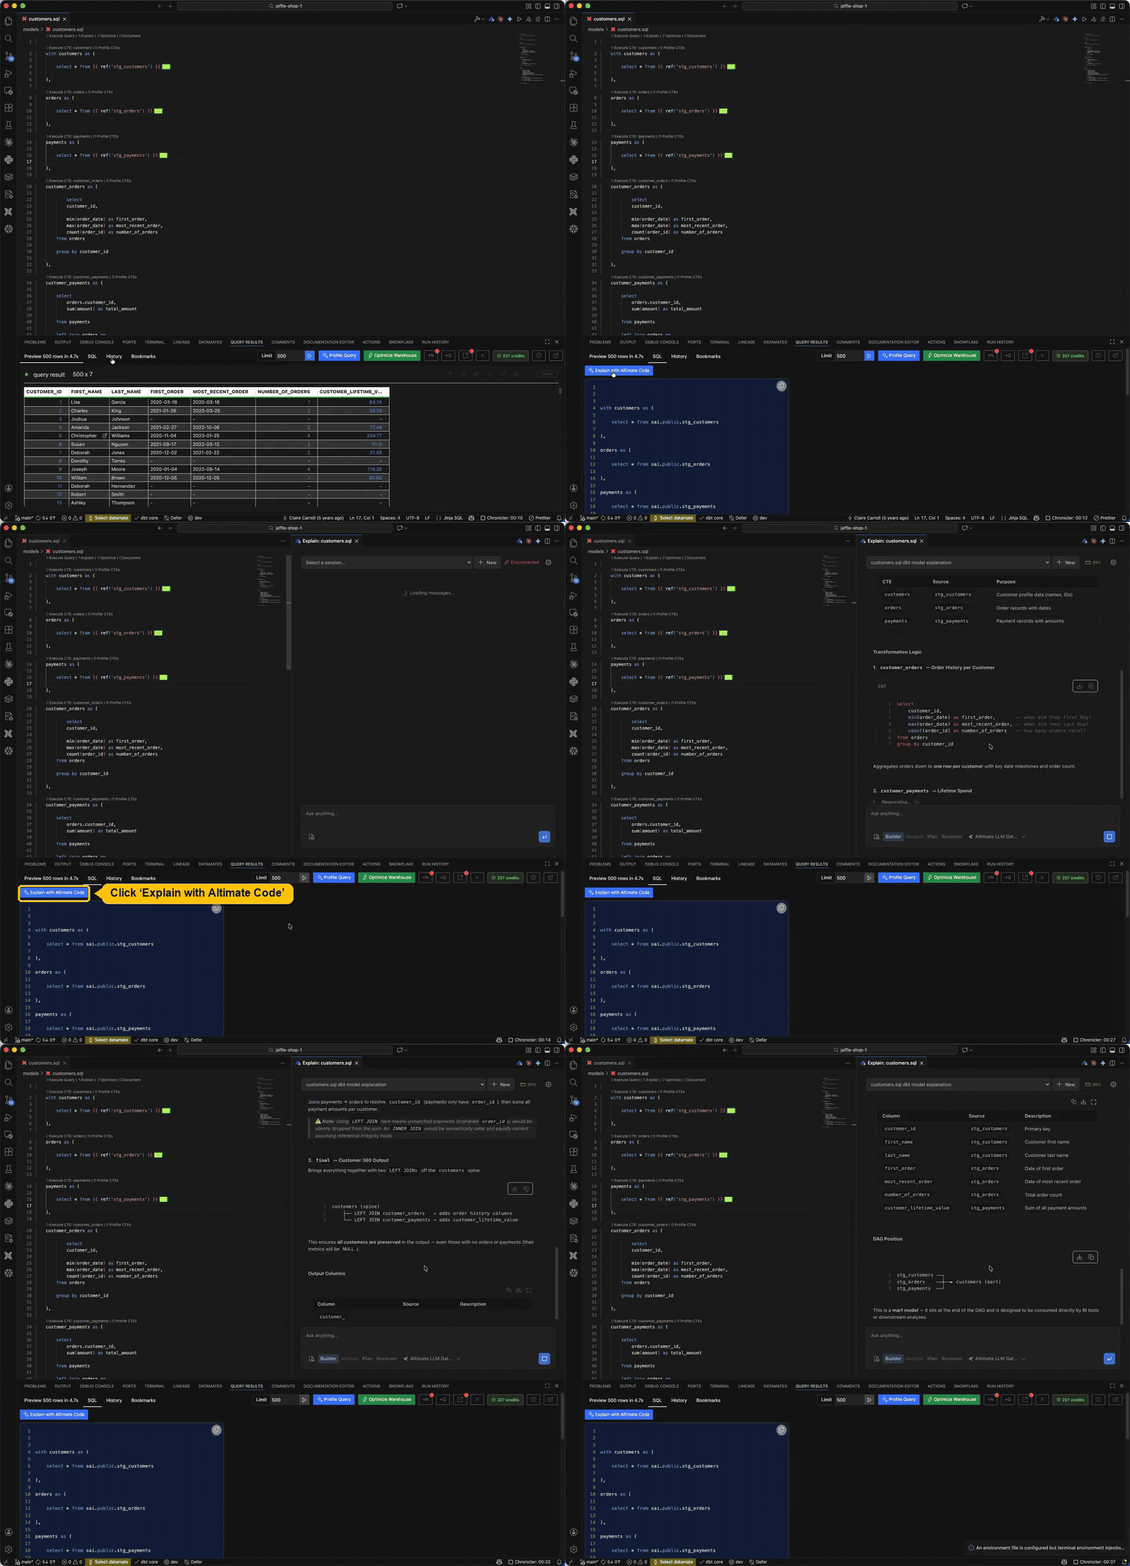
Both leave the context loaded in the chat, so a follow-up is one sentence. Ask why a step is expensive, or what changes if you filter earlier.
A profile does not promise a faster query and does not rewrite your model. It tells you what to try next.
So you get a named cause instead of a guess, read off the compiled query that actually ran. For the rest of the panel, see the Query Results panel guide.
Install the dbt VS Code extension
Frequently Asked Questions
Usually because of something the SQL text does not show. Your filter may be written so the warehouse cannot prune on it. Your join may explode before its filter runs. Your row estimate may be wrong by orders of magnitude. The warehouse names the real cause in its execution plan, and Profile Query reads that plan back to you in plain English.
In the Query Results panel toolbar. It only appears once a query has returned results, so run the query first. If you have results and no button, the panel is showing a view other than the default query result.
The compiled SQL, and it falls back to the raw query text only when no compiled version is available. This is the right choice for performance work, because the compiled query is what your warehouse executed.
Yes. Profiling works by running your warehouse's own EXPLAIN and reading what comes back, so with no connection configured there is no plan to read. This is the main way Profile differs from Explain, which only reads your code.
Yes. The tool runs the EXPLAIN of whichever warehouse you connected it to, so it is not built for one database. How deep the answer goes does depend on what your database reports. Snowflake does not support EXPLAIN ANALYZE, so there you get the plan and its estimates rather than measured runtime figures.
EXPLAIN returns the plan and the warehouse's estimates without running the query. EXPLAIN ANALYZE actually executes it and reports real numbers, so it is slower and costs a real run. The profiling tool defaults to plain EXPLAIN.
The most common cause is bind placeholders. A query still carrying ?, :name or $1 cannot be explained. The tool says so rather than passing a broken statement to your warehouse. Inline the values and run it again.
A chatbot can only reason about the text you gave it. It has no way to know your table sizes or your partitioning. It cannot know that the optimizer's row estimate was wrong by four orders of magnitude. Those facts live in your warehouse, and profiling is what brings them into the conversation.
No. It names the likely cause and suggests what to try. Applying a fix stays with you, and so does deciding whether the tradeoff is right for your model.